
A close above 7210 in Nifty is crucial for a rise ahead!!!!
OBSERVE!!!
Friday, February 19, 2016

Thursday, February 18, 2016
India: Nomura's proprietary indices suggest growth consolidation ahead..
Nomura has launched five proprietary indices to gauge India’s growth momentum and the near-term monetary policy path: · The Nomura Composite Leading Index (CLI)· India economic heat-map· Monthly Activity Indicator· Nomura Economic Growth Surprise Index for India (Bloomberg ticker: NGISOINR) and· Nomura RBI Policy Signal Index (Bloomberg ticker: NMEIRPSI). Going forward, we will monitor our growth and policy indicators on a monthly basis for early signs of any further deterioration in growth outlook or possible room for further easing.Overall, our proprietary indicators suggest that growth is headed into a consolidation zone into Q2 2016. The ongoing growth recovery is not yet broad-based. While urban consumption is strong, investments have slowed slightly. Services activity is mixed and industry is still sluggish. This suggests some downside risks to our baseline forecast of 7.8% GDP growth in 2016 (7.3% in 2015). Meanwhile, Nomura’s RBI Policy Signal Index indicates there is still scope for policy easing, but space is limited. We continue to expect a final 25bp rate cut in April.
Nomura has launched five proprietary indices to gauge India’s growth momentum and near-term monetary policy path: The Nomura Composite Leading Index (CLI), India economic heat-map, the Monthly Activity Indicator, the Nomura Economic Growth Surprise Index for India (NESII 2.0, Bloomberg ticker: NGISOINR) and the Nomura RBI Policy Signal Index (NRPSI, Bloomberg ticker: NMEIRPSI). While the CLI is a quarterly index, NESII 2.0 is a weekly indicator; all others are monthly (to learn more about the methodology behind our indicators, please see the Appendix).
• The Nomura Composite Leading Index, a leading indicator for non-agriculture GDP growth suggests that growth is headed into a consolidation zone into Q2 2016.
• Our economic heat-map indicates that the ongoing growth recovery is not yet broad-based. While urban consumption is strong, investments have slowed slightly. Services activity is mixed and industry is still sluggish.
• The Nomura Economic Surprise Index shows data has surprised negatively. However, it is close to a turning point, with a rising likelihood of positive data surprises in coming months (due to low expectations).
• The Nomura RBI Policy Signal Index indicates there is still scope for policy easing, but space is limited. Its latest value suggests a high likelihood of a 25bp rate cut. In our baseline, we expect the Reserve Bank of India (RBI) to deliver a final 25bp rate cut in April, utilising the room afforded by lower commodity prices (and weaker growth momentum).
• Overall, our proprietary indicators suggest an uneven nature of the recovery, which together with the weaker growth momentum in end-2015, suggests some downside risks to our baseline forecast of 7.8% GDP growth in 2016 (7.3% in 2015).
Economic recovery losing some steam
The Nomura Composite Leading Index (CLI), which leads India’s non-agriculture GDP growth by two quarters, suggests that the economic recovery, which began in Q4 2014, is headed into a consolidation zone into Q2 2016. The Nomura CLI is constructed using monetary, financial, domestic and external demand indicators and helps identify turning points in the growth cycle (Figure 2). A softening in non-oil imports growth and lower equity returns contributed to the softer growth momentum. However, with the latest reading still above 100, we believe the CLI suggests a mid-cycle consolidation, rather than the start of a downturn.
Our economic heat-map of high-frequency data, where the green shading denotes high growth and red shading denotes low growth, suggests that the growth recovery is not yet broad-based (Figure 1). Urban consumption demand (passenger cars, aviation traffic, diesel consumption, consumer credit) remains the brightest spot in the economy, boosted by higher real disposable incomes and lower commodity prices (lower costs), although car sales have eased lately. Rural consumption demand (for example, of two-wheelers) remains subdued. The services sectors, although not as strong as urban consumption, appear to be chugging along at a mixed pace, with the transportation segment (medium and heavy commercial vehicles) the strongest component. On the investment front, capital goods output growth has slowed slightly, probably reflecting weaker private sector demand, while public (government) capex continues to grow at a healthy pace. In contrast, both the industrial and external sectors remain in the red, suggesting continued stress.
Overall, of the 32 indicators in our heat-map, the proportion indicating a pick-up in growth rose to 52% in December from 24% in November. Our Monthly Activity Indicator, a weighted average growth combining the high-frequency data in the economic heat-map, is tracking 7% in December, down from an average of 8.2% in Q3 2015, indicating slight softening in growth momentum towards end-2015 (Figure 3).
The Nomura Economic Surprise Index for India (NESII 2.0) fell to -0.25 in January from -0.06 at end-December 2015, indicating negative surprises for incoming data relative to consensus expectations. A lower-than-expected reading on the manufacturing PMI and industrial production, along with a higher CPI reading were responsible. Indeed, the growth-inflation mix has been disappointing lately (see India: Disappointing growth-inflation mix, 12 January 2015). However, since NESII is mean-reverting by nature, its current value suggests that the likelihood of positive data surprises in the coming months (due to low expectations) is rising (Figure 4).
The Nomura RBI Policy Signal Index (NRPSI), which measures the relative probability of monetary policy tightening or loosening in the near term, indicates a high likelihood of a 25bp rate cut. The NRPSI is historically seen to have a strong indicative power of policy actions. In January 2016, the NRPSI stood at -0.24 (similar to December) and similar to its level in end-2014, which was followed by 25bp rate cut. The sharp fall in oil prices (-35% y-o-y), CPI inflation tracking below the Reserve Bank of India’s inflation target (6% for January 2016) and a continued double-digit contraction in exports, is currently driving the NRPSI in the dovish zone. Historically, NRPSI values close to -0.5 have coincided with larger than 25bp, or a series of 25bp rate cuts in quick succession, while values close to 0 have indicated a neutral policy stance. Therefore, January’s NRPSI value indicates there is still some scope for policy easing, but space is limited.
Fig. 1: India economic heat-map (Green = high growth; red = low growth)
|
Source: CEIC and Nomura Global Economics. *Index values. Note: The period of comparison is 2012 to date. Dark green shading suggests the fastest growth since 2012, while dark red suggests the slowest growth since 2012.
|
|
|
|
|
Conclusion: Overall, Nomura’s proprietary indices for India, together with the high-frequency data, indicate some slowdown in the growth momentum towards end-2015 and a high likelihood of further monetary policy easing. While improving urban consumption demand and a robust transportation sector are supporting growth, weak external conditions and sluggish investment demand are weighing on the pace of the recovery. The uneven nature of the recovery, together with weaker growth momentum in end-2015, suggests some downside risks to our baseline forecast of 7.8% GDP growth in 2016 (7.3% in 2015). We expect the RBI to deliver a final 25bp rate cut in April, utilising the room afforded by lower commodity prices (and weaker growth momentum). Beyond that, we expect the RBI to stay on hold until end-2016. We will monitor our growth and policy indicators on a monthly basis for early signs of any further deterioration in growth outlook or possible room for further easing.
Wednesday, February 17, 2016
Economic Recession- Comprehensive
Are we there yet? Not yet according to this well respected arbiter. Back to Fed watching. Their actions in 2011 staved one off, we may be in for a repeat.
A raft of analysts, perma-bears and bloggers are playing fast and loose with the R-word again. This is likely to reach a crescendo with the release today of the unexpected large drop in the ISM non-manufacturing survey. We recall a time in late 2011 when the mainstream perception was that we were headed for recession and we posted a widely read article that went against the mainstream, and attracted attention of some respected names:

Given the amount of attention looming recession calls are getting, we thought it prudent to throw our observations into the hat.The main reasons for most parties claiming we are in recession are the SP-500 earnings recession, stock markets, the widening credit spreads, Weekly Leading Indicators and Industrial production/Manufacturing. Next week, see the articles about the ISM non-manufacturing PMI crawl out the woodwork. Let’s look at each of these in turn.The SP-500 earnings are indeed in recession and this is normally a strong predictor of economic recession and bear markets:

However, if you dig under the hood, the earnings recession is mostly a function of the hammering taken by the Energy and the Materials sectors. It is debatable if these sectors make up enough of the economy to drag it into recession:

The stock markets are indeed pricing in recession, as shown with the Stock Market Composite of economically sensitive stocks which is one of the components of our Weekly Leading Economic Index (WLEI):

However, we all know the story about the stock market predicting 12 of the last 6 recessions with the false alarms shown above.Third up is a favorite of the bears, namely widening Credit Spreads. Whilst corporate bond spreads (WAAA/WBBB, -WBBB and T-Bill/BBB) are indeed flagging emphatic recession (bottom chart in the pair below), when one views a very broad basket of over 35 credit spreads (top chart below), the picture is far less bearish (albeit at concerning levels). The top chart is updated weekly and is also a component of our Weekly Leading Economic Index (WLEI)

The widely followed ECRI Weekly Leading Index also is flagging recession, but it has done so three times already this expansion. Whilst our own WLEI has not flagged an alert before 21/08/2015, it now joins the ECRI WLI in an emphatic recession call.

Weekly leading indicators are much noisier than monthly ones so one would observe several weeks of recession signal before reading anything into it. This wait period has passed and so we need to determine the possibilities. Our Weekly Index, which is published for subscribers every Thursday evening, consists of 5 groups of composites covering corporate & treasury bonds, stock markets, employment and credit spreads and is made up of just over 100 weekly time series:
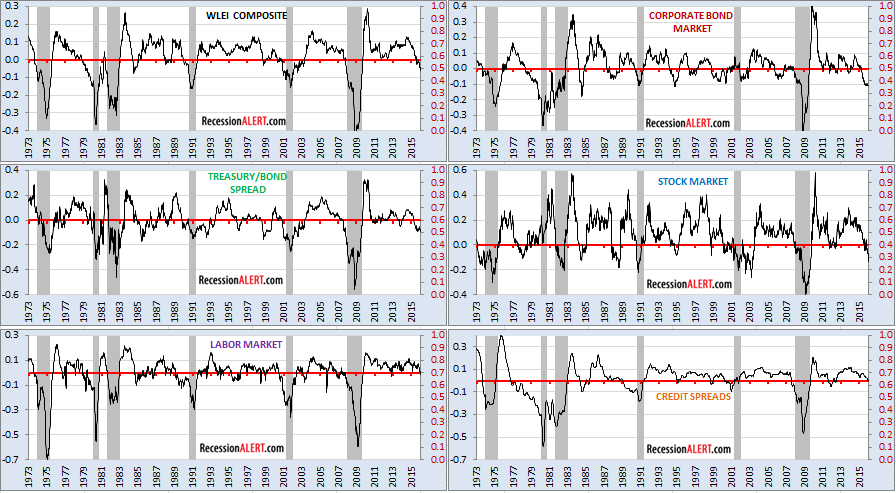
The WLEI is negative now because of the heavy weighting (60%) made up of the Corporate Bonds composite, the Treasury/Bond composite and the Stock Market composite. As we have warned subscribers in the past, we do not believe the 5 major categories above may be broad enough to properly encapsulate all manner of recessions and we are on the hunt for a sixth that also only contains weekly data of a short-leading nature (we do not believe in mixing long leading indicators with a short leading system nor mixing monthly time series with weekly ones.)Also note from the first chart above that there have been 3 false alarms since 1973 with the depth of the current readings consistent with the 1984 false alarm. Thus, whilst the WLEI flags caution we do not use it for performing actual stock market actions at this point.The fifth item hauled out the bag to argue for recession is Industrial Production which is indeed in recession. Unlike past declines in industrial production, the current decline has been driven primarily by the collapse in the utilities industry (weather) and mining (impacted by energy) which make up just 25% of Industrial Production.

During 1985/6, declining oil prices and a rapidly rising dollar also led to an Industrial Production slump. This did not turn into a recession. There is a great piece on this here.Now we move onto Manufacturing which makes up about 70% of Industrial Production and 12% of US GDP. The output from U.S. factories has been little changed recently, although the main manufacturing indicator being watched, the ISM PMI composite, is indeed below the expansion level of 50. In the last few decades, it was not unusual for the ISM to signal recession as the broader economy remained in expansion.

The real rebuttal against the ISM Manufacturing PMI warning is highlighted by Tom Porcelli at RBC Capital Markets who stated “One of the reasons to believe the so-called manufacturing ‘recession’ is likely to be short-lived is that it has been limited to a handful of industries. In other words, it has not been a pervasive slowing.” There is nice coverage on this at Business Insider.

Lastly, lets cover the latest candidate to be trotted out in ensuing days. Non-manufacturing (a large chunk of the economy) is weakening, with an unexpected downturn on the latest reading, the biggest one-month decline since the recession. But it will require another two such drops to get to contraction territory:

We know that manufacturing is about 12% of the US economy (red line below). We also know that the manufacturing and the non-manufacturing sectors together make up 90% of the US economy. This means non-manufacturing (green line below) makes up 78% of the economy. We can combine these two according to their relative weights to give a representation of 90% of the US economy as at January 2016:

There was a disconcerting plunge in January, but no recession signal yet.Now lets focus on the arguments AGAINST recession.Firstly, our own Monthly Leading SuperIndex, a very broad indicator used in Jan 2012 to dispute recession mania, is weakening, but not flagging recession:

Secondly, there are precious few long-leading indicators flagging recession. Until we find long leading data (except of course corporate profits and corporate bond spreads) that concurs with future recession, we will have difficulty raising red flags on the economy. Our own long-leading indicator, USLLGI, tracks the growth of 8 reliable indicators which have consistently peaked 12-18 months before the onset of NBER defined recessions since the early 1950’s :

The National Buro for Economic Research (NBER) are the final arbiters of recession dating in the U.S. The NBER does not define a recession in terms of two consecutive quarters of decline in real GDP. Rather, a recession is a significant decline in economic activity spread across the economy, lasting more than a few months, normally visible in real GDP, real income, employment, industrial production, and wholesale-retail sales.They will be examining 4 monthly co-incident indicators:
- Industrial Production
- Real personal income less transfers deflated by personal consumption expenditure
- Non-farm payrolls
- Real retail sales deflated by consumer price index
We used the above 4 indicators to create a “NBER Big-Four” composite index many moons ago. It is also showing disconcerting sluggishness, but no immediate signs of recession:

There are however some short-leading indicators not often mentioned that warrant concern. Here are some taken from our Monthly Long Leading Composite Index:


..and here is one to watch closely:

To summarize, despite many pockets of disconcerting co-incident indicator weakness, many brought on by the energy and commodities complex, the risk of near-term recession appears low. Although many short-leading indicators are showing recession there are not enough of them yet to warrant a confident recession call. What remains highly elusive is finding long-leading data that points to recession.
Recession odds are rising, as is commentary surrounding recession. Most of this commentary centers around “cherry picking” this or that indicator or sector to bolster an argument but rarely covers broad-based assessments. One thing is for certain – watching co-incident, short and long leading data closely is going to be back in vogue over the coming months:

Just like 2011/12 it is going to make for some interesting times
Enjoying Nifty
SEE OUR YESTERDAY'S FIGURE OF NIFTY!!!!!!
Sold @ 7195 or just kept watching ?????? it closed at 7054!!!

Sell Nifty @ 7085-7160
Sold @ 7195 or just kept watching ?????? it closed at 7054!!!

Sell Nifty @ 7085-7160
Tuesday, February 16, 2016
How European banks are scaring away their investors
Falling bank shares
Some of the oldest financial houses are at the eye of a new financial storm

IF THE start of the year has been desperate for the world’s stockmarkets, it has been downright disastrous for shares in banks. Financial stocks are down by 19% in America. The declines have been even steeper elsewhere. Japanese banks’ shares have plunged by 36% since January 1st; Italian banks’ by 31% and Greek banks’ by a horrifying 60% (see chart). The fall in the overall European banking index of 24% has brought it close to the lows it plumbed in the summer of 2012, when the euro zone seemed on the verge of disintegration until Mario Draghi, the president of the European Central Bank (ECB), promised to do “whatever it takes” to save it.

The distress in Europe encompasses big banks as well as smaller ones. It has affected behemoths within the euro area such as Société Générale and Deutsche Bank (see next story)—both of which saw their shares fall by 10% in hours this week—as well as giants outside it such as Barclays (based in Britain) and Credit Suisse (Switzerland).
The apparent frailty of European banks is especially disappointing given the efforts made in recent years to make them more robust, both through capital-raising and tougher regulation. Euro-zone banks issued over €250 billion ($280 billion) of new equity between 2007, when the global financial crisis began, and 2014, when the ECB took charge of supervising them. Before taking on the job, it combed through the books of 130 of the euro zone’s most important banks and found only modest shortfalls in capital.
Some of the recent weakness in European banking shares arises from wider worries about the world economy that have also driven down financial stocks elsewhere. A slowdown in global growth is one threat. Another is that the negative interest rates being pursued by central banks to try to prod more life into economies will further sap banks’ profits. A retreat in Japanese bank shares turned into a rout following such a decision in late January. Investors in European banks fret not just about lacklustre growth but also a possible move deeper into negative territory by the ECB in March. On February 11th Sweden’s central bank cut its benchmark rate from -0.35% to -0.5%, prompting shares in Swedish banks to tumble.
But the malaise of European banking stocks has deeper roots. The fundamental problem is both that there are too many banks in Europe and that many are not profitable enough because they have clung to flawed business models. European investment banks lack the deep domestic capital markets that give their American competitors an edge. Deutsche, for instance, has only just resolved to hack back its investment bank in the face of a less hospitable regulatory environment following the financial crisis.
And there are still too many poorly performing smaller banks within national markets. Although this year’s share-price declines have been steepest in Greece, these largely reflect renewed political tensions over implementing the country’s third bail-out. The banks arousing fresh concern are those in Italy, whose troubles go beyond an excess of them. One specific worry is the dire state of the country’s third-biggest (and the world’s oldest) bank, Monte dei Paschi di Siena, which has long been in intensive care and whose share price has fallen by 56% this year. Its woes reflect poor governance, a problem that plagues Italian banks, many of which are part-owned by local, politically connected foundations.
A more general worry is that Italy’s banking sector as a whole is weighed down with bad loans which have built up during recent years. Although Italian GDP has been expanding since the start of 2015, it is still around 9% lower than its pre-crisis peak in early 2008. This has hurt Italian firms—and their pain has been transferred to the banks that lent to them. Gross non-performing loans amount to €360 billion (18% of the total), of which €200 billion are especially troubled.
There is nothing new about Italy’s high level of non-performing loans; if the recovery can be sustained they should eventually start to come down. Moreover, over half of the sourest loans are covered by provisions, which means that the potential bill is more manageable, at around €90 billion rather than €200 billion. What has changed this year is a new European approach to tackling troubled banks, which shifts the burden for bail-outs from taxpayers to creditors who are “bailed in” when big losses arise. These rules, which have come fully into force this year (a few countries applied them in 2015), mean that senior bondholders and depositors with balances above €100,000 can be stung when banks are resolved.
Bank bonds are generally held by institutional investors who can look after themselves, but in Italy around €200 billion are in the hands of retail customers who were lured to invest in them until 2011 by favourable tax treatment. These retail bonds would be vulnerable if banks run short of capital after big write-downs.
This danger was highlighted late last year when four small banks were rescued in a rush to avoid this year’s more stringent bail-in provisions. That process ensnared retail bondholders holding junior debt, who could already be bailed in under the previous rules. One committed suicide. The furore has unnerved Italians. Ignazio Visco, governor of the central bank, has said that a less abrupt transition to the new bail-in regime would have been better.
The strict rules have also curtailed the ability of the Italian government, led by Matteo Renzi, to calm nerves by excising the bad loans from the banking system. Instead of setting up a state-backed “bad bank” to remove them, Mr Renzi has had to adopt a feebler approach in which the government will guarantee the senior tranches of securitised bundles of the bad loans. Investors plainly doubt this scheme will help much, to judge by the performance of Italian bank shares.
Frustration with European constraints on Italy’s attempt to sort out its banks is one reason why Mr Renzi has been making barbed attacks on the German way of running the euro area. Such political tension is adding to jitters about Italian banks. Portuguese banking shares have also tumbled, in part because a new left-of-centre coalition government alarmed international investors by its decision to impose heavy losses on some senior bank bonds late last year. In seeking to transfer the risk of failing banks away from taxpayers to creditors, European policymakers may have thought they were depoliticising the banks. In the euro-zone periphery, however, politics is never peripheral.

Monday, February 15, 2016
Gold - A hedge against ignorance
Investors are cautiously returning to a fickle market

THE Valentine Day’s special at Sharps Pixley, London’s first high-street bullion showroom, is a £115 ($166) rose dipped in gold. But what that special someone would really want is the £27,000 “kilobar”, smaller than a slab of chocolate but reassuringly weighty in this time of turmoil in financial markets. Both have sold well since the shop opened last month, says Ross Norman, the boss. Yet he is struck by how “apologetic” his British clients are about buying gold. It suggests many are novices, gingerly placing their first bets against the global economy.
They are not alone. From libertarians in America to Indian housewives, gold’s fans have helped push spot prices up sharply this year, defying the rout in global commodity markets (although gold also defied the prior boom in commodities—see chart). In early trading on February 11th gold surged above $1,200 an ounce, its highest level in more than eight months, amid a big sell-off in global stockmarkets. Mr Norman notes that January rallies in the past two years quickly petered out, partly for seasonal reasons: retail buying in the biggest markets, India and China, starts with the Hindu Diwali festival in late autumn and ends at this time of year with Chinese new year. He says the rally is still tentative, though this year “it has a bit more oomph.”

Fear is one source of oomph. One Swiss-based bull likes to call gold “a hedge against ignorance”, noting the myriad question-marks hanging over the global economy. They include the strength of China’s economy, the impact of falling oil prices on emerging-market producers, the debt woes in America’s shale-oil industry and the fragility of global banks. What’s more, the dollar—which rivals gold as a haven—has also weakened recently.
Other factors have been on gold’s side. Its recent rally has coincided with falling oil prices and renewed fears of deflation that have pushed down interest rates. Because gold offers no yield, the lower the returns offered by alternative investments such as bonds, the more attractive it looks. The move by big central banks to impose negative interest rates on commercial-bank deposits makes gold an even more attractive store of value—the shiny equivalent of cash under the mattress.
Supply may also help the bulls’ case. The World Gold Council said on February 11th that the amount of gold mined in the fourth quarter of 2015 was down by 3%, its first quarterly drop since 2008. It expects the trend to continue as cash-strapped mining firms trim investment.
The demand picture is more nuanced. Overall, global demand dipped slightly in 2015. But Indians vastly increased their holdings of gold jewellery in the second half of last year, befitting one of the world’s fastest-growing economies. In China, shoppers bought fewer gold trinkets but more gold coins and bars as investments, perhaps reflecting concerns about their falling currency and stockmarket.
This year the latest data suggest there has been a net inflow of funds into gold-related exchange-traded funds, which are investment vehicles that account for about a tenth of global gold demand, says the World Gold Council’s Juan Carlos Artigas. He expects buying by central banks in the developing world, which surged in the fourth quarter, to continue as they diversify their assets.
Sceptics—among them Goldman Sachs, an investment bank—nonetheless argue that gold will fall for a fourth straight year in 2016, largely because of higher interest rates in America. On February 10th Janet Yellen, chair of the Federal Reserve, offered a downbeat assessment of the American economy in testimony to Congress. Though she still left the door ajar to further rate rises, stockmarkets and the dollar reacted negatively, while gold rallied. The more pressing financial fears become, the higher it is likely to go
Subscribe to:
Posts (Atom)