By Arthur. Berman, a petroleum geologist with 36 years of oil and gas industry experience. He is an expert on U.S. shale plays and is currently consulting for several E&P companies and capital groups in the energy sector.
U.S. rig counts have surged as oil prices sink. Capital is driving the oil markets and it enables bad behavior by producers. That is why oil prices will stay low.
The oil-price rally that began in February is over. Prices rose from $26 per barrel to $51 by early June and are now below $42 (Figure 1). If they fall through $40, the next likely support level is at $36 per barrel.
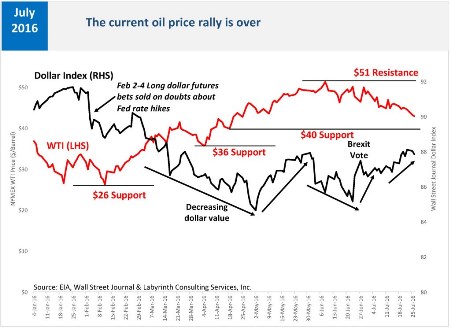
Figure 1. The current oil-price rally is over. Source: EIA, Wall Street Journal and Labyrinth Consulting Services, Inc.
Capital Drives The Oil Market and Prices
Most people think that fundamentals–supply and demand–drive the oil market but capital drives the market and oil prices.
More than anything, rig count reflects capital flow. Many believe that oil prices drive the rig count but it is really capital flow that drives rig count and production and that affects oil prices.
When oil prices fall and oil-price volatility increases, the floodgates of capital open. Every genius-investor wants to buy low and sell high. Rig count rises with fresh capital, production increases and oil prices fall (Figure 2). The weekly change in tight oil horizontal rig count is the leading indicator of capital expenditures. Price trends roughly follow the inverse path.
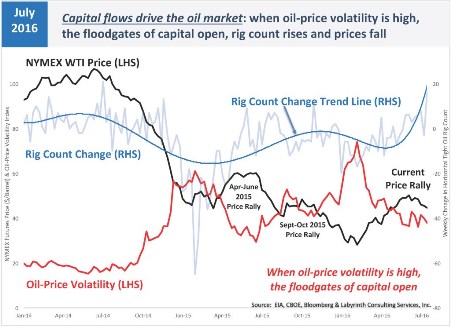
Figure 2. Capital flows drive the oil market. Source: EIA, CBOE, Bloomberg and Labyrinth Consulting Services, Inc.
When oil prices were around $100 per barrel in mid-2014, oil-price volatility was low. When prices fell below $90 per barrel in October 2014, oil-price volatility began to increase. When prices bottomed below $46 in January 2015, volatility peaked. Correctly believing that a price floor had been reached, investors poured capital into the markets and oil companies were flush with money to start drilling again. Prices rose to $60 per barrel by May 2015.
As drilling proceeded, oil-prices began to fall as market confidence in a price recovery faded. In July 2015, prices began to fall. As they fell to near $40 per barrel by late August, price volatility increased again. Investors saw another price floor and opened their wallets.
Prices rose 18 percent to more than $48 by early October but by then, confidence in a price recovery again faded with increased drilling and global economic concerns about Chinese growth and oil demand. Oil prices fell below $30 in late January 2016 and by mid-February, oil-price volatility reached its highest level since the Financial Collapse in November 2008.
Once again, investors saw a price floor and the floodgates of capital opened. Pioneer and Diamondback raised almost $1.5 billion in share offerings in January 2016, probably the darkest time for oil markets since 1998.
In the first half of 2016, more capital has flowed to E&P companies than during 2013, the previous record year when oil prices were more than $100 per barrel and the tight oil boom was in full bloom (Figure 3).
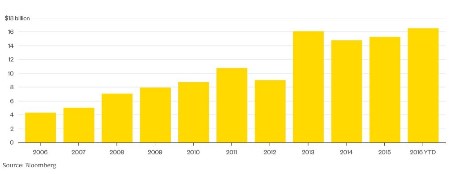
Figure 3. U.S. E&P companies have sold more stock so far this year than in the whole of the record year of 2013, when oil averaged almost $100 a barrel. Source: Bloomberg.
Rig Count Surges and Oil Prices Fall
During the current price rally, prices increased from $26 in mid-February to more than $51 per barrel by early June. Meanwhile, the rig count change rate has exploded (Figure 2). Predictably, oil prices have fallen below $42 per barrel as hopes for a price recovery fade once again. This repeating process qualifies under the standard definition of insanity – namely, continuing to do the same thing that got you in trouble before.
66 land rigs and 47 tight oil horizontal rigs have been added since early June (Figures 4 and 5). Last week, prices were crashing but 18 rigs were added, the biggest increase in almost 2 years.
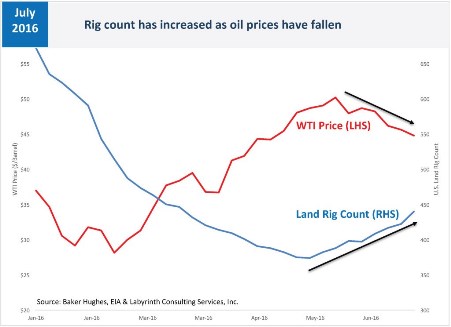
Figure 4. Rig count has increased as oil prices have fallen. Source: Baker Hughes, EIA and Labyrinth Consulting Services, Inc.
Those added rigs, however, resulted from decisions and a process that began weeks or even months ago. After a company decides to add a rig, negotiations follow. More time passes between signing a contract and a rig showing up on location. Empirically, there is about a 5-week lag between changes in price trends and a response in rig count (Figure 5).
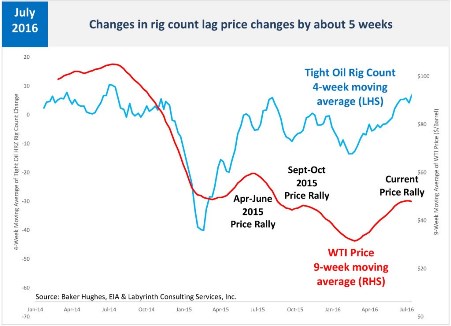
Figure 5. Changes in rig count lag price-trend changes by about five weeks. Source: Baker Hughes, EIA and Labyrinth Consulting Services, Inc.
Who Are Those Guys?
Which companies are adding rigs and do their financial results support more drilling at these oil prices?
About 60 percent of rigs added in the tight oil plays during the last few months are in the Permian basin where there are currently 145 rigs operating (Figure 6). The rest of the new drilling is fairly evenly spread among the Bakken, Eagle Ford, Niobrara, Mississippi Lime and Granite Wash plays.
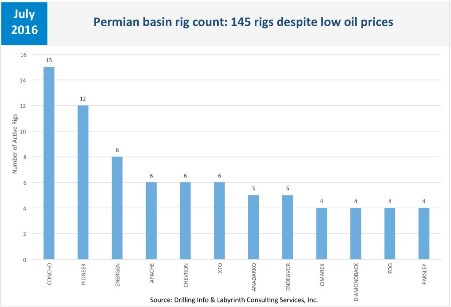
Figure 6. Permian basin rig count: 145 rigs despite low oil prices. Source: Drilling Info and Labyrinth Consulting Services, Inc.
The most active operators in the 3 most-productive plays–the Permian, Bakken and Eagle Ford–are shown in the table below.
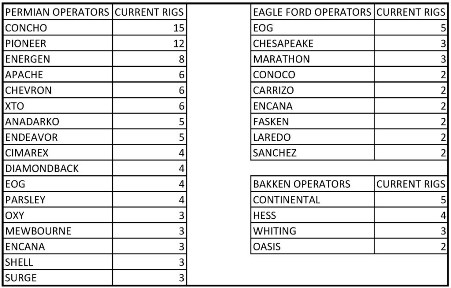
Table 1. Leading tight oil rig operators for the week ending July 22, 2016. Source: Drilling Info and Labyrinth Consulting Services, Inc.
In the Permian basin, Concho Oil & Gas currently operates 15 rigs, Pioneer Natural Resources operates 12 rigs, and Energen operates 8. Apache, Chevron and XTO each operate 6 rigs, and Anadarko and Endeavor each operate 5. Cimarex, Diamondback, EOG and Parsley all operate 4 rigs.
The most active operator in the Eagle Ford play is EOG with 5 rigs. EOG is followed by Chesapeake and Marathon each with 3 rigs. In the Bakken, Continental Resources is the leading operator with 5 rigs. Hess operates 4 rigs, Whiting operates 3 and Oasis, 2 rigs.
So how are these operators doing financially?
Terribly, despite preposterous stories of technology gains, costs approaching zero, and single-well EURs of 1 million barrels of oil equivalent.
Figure 7 shows the main rig operators in the Permian, Bakken and Eagle Ford plays. These companies spent an average of 4 times as much as they earned in the first quarter of 2016. And it’s been going on for years. Imagine doing that yourself.
Among Permian operators, Parsley spent more than 10 times cash flow and Energen, more than 6. Pioneer and Chevron spent 5 times more than they earned. Anadarko had negative cash from operations meaning that it didn’t even earn enough to pay for well operations.
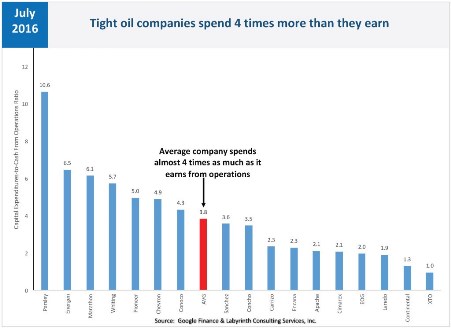
Figure 7. Tight oil companies spend 4 times more than they earn. Source: Google Finance and Labyrinth Consulting Services, Inc.
EOG leads the drilling in the Eagle Ford play and only spends twice what it earns–among the best of a bad lot. Marathon, on the other hand, outspends earnings by more than 6-to-1 and ConocoPhillips is not much better at more than 4-to-1. Like Anadarko, Chesapeake has negative cash from operations and, therefore, does not appear in Figure 4.
In the Bakken play, Hess cannot even pay for well operations from its cash flow yet operates 5 rigs. Continental Resources leads Bakken drilling and has a respectable capex-to-cash flow ratio only spending $1.30 for every dollar it earns. Whiting outspends cash flow by almost 6-to-1 and Oasis has negative cash from operations.
The debt picture is equally grim.
It would take top tight oil rig operators an average of 10 years to pay off debt if all cash earned from oil and gas sales were exclusively for that purpose based on first quarter 2016 financial data–in other words, no drilling, no salaries, no nothing except debt payments (Figure 8). That’s way above standard tolerance for this critical measure of bank risk which is now about 4:1 but before 2012, it was closer to 2:1.
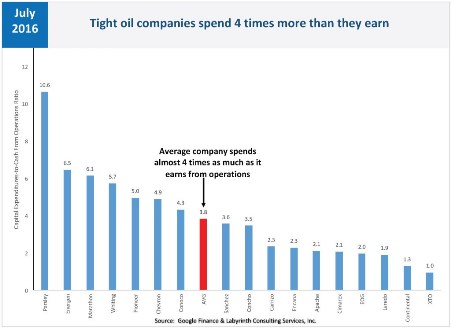
Figure 8. Tight oil companies would take 10 years to off debt using all cash from operations. Source: Google Finance and Labyrinth Consulting Services, Inc.
In the Permian basin, most operators have a debt-to-cash flow ratio of about 6:1 or 7:1. Chevron and Pioneer are much higher at 9.3:1 and 8.2:1, respectively. It would take Apache 8 years to pay off its debt and 7.4 years for Concho. Cimarex is somewhat lower at 4.4 years and not surprisingly XTO (ExxonMobil) is at 2.2 years.
In the Eagle Ford play, EOG has more debt than it could pay off in 6 years and Marathon has a stunning debt-to-cash flow ratio of almost 25! Conoco is not far behind at almost 18-to-one.
In the Bakken play, Continental would need 6 years to pay off its debt but Whiting leads all major tight oil players with a debt-to-cash flow ratio of 29-to-1!
Meanwhile, these companies tell investors tall tales of fantastic rates of return even at low oil prices that clearly do not pass even a superficial fact check using Google Finance or Yahoo Finance. Why would any rational investor give money to most of these companies?
Short-Term Price Spikes In a Few Years
There is an important difference between oil supply and reserves. Supply is available on demand and reserves require long-term, capital-intensive investment to develop.
Tight oil is really a supply project because reserves can become supply one well at a time. Tight oil development can be turned on or off at will as prices rise and fall because at-risk capital is incremental–basically the cost of the number of wells in a rig contract.
While tight oil supply has overwhelmed markets in recent years, remaining reserves are relatively small–a few tens of billions of barrels–compared with true reserve projects like conventional and deep-water oil or oil sands that involve hundreds of billions of barrels. True reserve projects have been largely deferred because of uncertainty about how long low prices will continue.
The insane cycling of oil prices will continue as long as tight oil production keeps the market in a supply surplus. At some time in the next few years, the market will go into deficit as deferred investment in reserve projects comes back to haunt us. Then, inventories will finally be drawn down to 5-year average levels and prices will probably spike.
If that happens, it is likely that prices may go well above $90 per barrel. This may last for a year or somewhat longer based on what occurred in 1979-1981 (27 months), 2007-2008 (13 months) and 2010-2014 (48 months) when prices were more than $90 per barrel. Then, demand destruction will set in and prices will fall. Because the global economy is so much weaker now than during those past periods of high oil prices, I suspect that it will only take a few months to a year before prices fall hard.
Lower Prices Ahead
The current oil-price rally led many to believe that a full price recovery was underway. But inventories have been too large for that to happen short of epic supply interruptions. Current OECD inventories stand at 3.1 billion barrels and untold millions of barrels in places like China and Russia that do not report storage volumes.
In mid-April, I cautioned:
Two previous price rallies ended badly because they had little basis in market-balance fundamentals. The current rally will probably fail for the same reason.
You don’t have to be a genius to figure this stuff out. Attention to data and recent history is all it takes.
So, why do producers misread price signals so badly and act in ways that lower prices and hurt their own businesses?
They can’t help themselves. Give them money and they will spend it. That’s what E&P companies do.
The cost of credit dictates the precedence of cash flow over common sense even as more debt and the growing burden of debt service dictate even more production to meet new cash flow demands.
It is a vicious cycle that cannot be broken unless the capital stays away. That has not happened because other options for similar yields at acceptable levels of risk cannot be found. And so it continues.
The longer companies continue to produce at a loss and make absurd claims that they are making money at low prices, the more that investors believe them. The market graciously obliges by shorting oil prices.
I see no graceful way out of all of this.
No comments:
Post a Comment
Note: Only a member of this blog may post a comment.