About Me

My photo
An Investor and counsellor in Financial Market

Thursday, January 31, 2019

Saudi Arabia Plays Both Sides Of Russia-U.S. Spat

Desert
Saudi Arabia is putting itself in a potentially dangerous geopolitical position as it seeks to continue its decades' long relationship with Washington while at the same time forging new ties, mostly based on oil markets cooperation, with Moscow.
The latest installment in this Saudi narrative came on Tuesday when Saudi Aramco said at the yearly World Economic Forums in Davos, Switzerland that it’s looking to acquire natural gas assets in the U.S. and is willing to spend “billions of dollars” there as it aims to become a global gas player. Saudi Aramco has recently diversified its holdings in many countries by investing in downstream assets, including currently owning the Motiva complex in Texas, the biggest oil refinery in the U.S.

Saudi Aramco Amin Nasser told Reuters at the forum that it intends to invest another $10 bn in the Motiva complex. He added, “We do have appetite for additional investments in the United States. Aramco’s international gas team has been given an open platform to look at gas acquisitions along the whole supply chain. They have been given significant financial firepower – in the billions of dollars.” Saudi Aramco has already indicated its interest in becoming a global gas and LNG player and one day exporting the fuel, but it has a long way to go put the infrastructure in place before they can come to fruition.
Playing both sides
However, despite Saudi Arabia’s close ties to U.S., dating back to the administration of Franklin Roosevelt during World War II and then afterwards when American oil industry know-how, management, best practices, and funds helped develop the Saudi oil industry and propelled it to where it is today, Riyadh has also been forming closer times with one-time adversary Moscow.
The growing ties with Russia were born of oil market necessity. The two sides agreed to put an oil production cut deal in place in 2016 to drain down then oversupplied markets, with a downward trajectory on oil prices that saw Brent crude futures plummet from around $100 per barrel in mid-2014 to breaking below the $30 per barrel price point by early 2016. Thus was born the OPEC+ group of oil producers, led by Russia and Saudi Arabia.
Since their first oil cut agreement in 2016, the two countries last year agreed once again to cut output to drain down oil inventories amid fears of a global oil demand slowdown due to the ongoing trade war between the U.S. and China, and weakness in emerging markets coming at the same time as record high production from the U.S., Russia and Saudi Arabia - the world’s top three oil producing nations.
The Russians and Saudi are now also considering tie-ups in gas, with Saudi Arabia looking to become a major investor in Russia’s fledgling but forward-thinking LNG sector that Russian President Vladimir Putin claims can one day compete with Qatar, Australia and the U.S. to be the top global LNG export leader. Therein lies the rub. As Riyadh and Moscow continue to boost their oil and gas interdependence both in terms of investment in each others’ sectors but also in terms of controlling global oil prices, the two sides will also increasingly forge an alliance geopolitically, which includes in the always violate middle-east where the U.S. and Russia are usually at odds, including being on opposite sides in the ongoing Syrian Civil War.
While it may be a number of years before it develops, there will come a time when Riyadh will be forced to choose sides between U.S. interests and Moscow’s growing regional hegemony ambitions and its increased influence in the middle east. At the end of the day, it’s a decision that no Saudi leader should be looking forward to (one that will likely fall on the shoulder of Saudi Crown Prince Mohammad bin Salman). It’s also a decision nonetheless that could dictate both global oil and gas markets and middle eastern regional stability for decades.

Wednesday, January 30, 2019

Key Indicators Suggest A Recession Is Closer Than We Thought

Globe

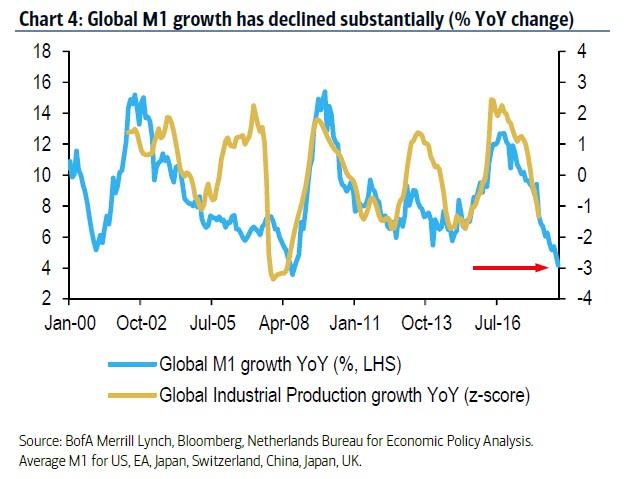
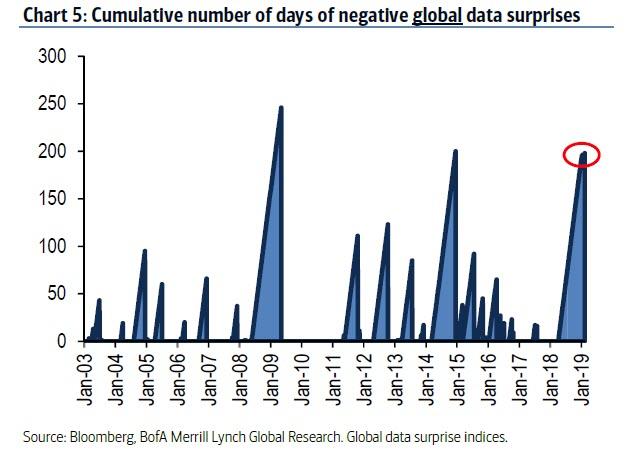
There is a  collapse of global money supply which has been declining rapidly over the last year and a half. In fact, global money supply growth (using M1) is now flirting with the lows seen in mid-2008. And while some economies, such as China, are now desperately trying to pivot back to supportive measures, BofA's Barnaby Martin recently warned that high global debt will constrain enthusiasm for engaging in further rounds of stimulus. Meanwhile, as the chart below suggests, lower money supply growth has always pointed to weaker global economic momentum going forward. In fact, if one uses Global Industrial Production growth as a proxy for the global economic expansion, or contraction, the World is now almost certainly in a recession; the only question is when will economists acknowledge it.
(Click to enlarge)
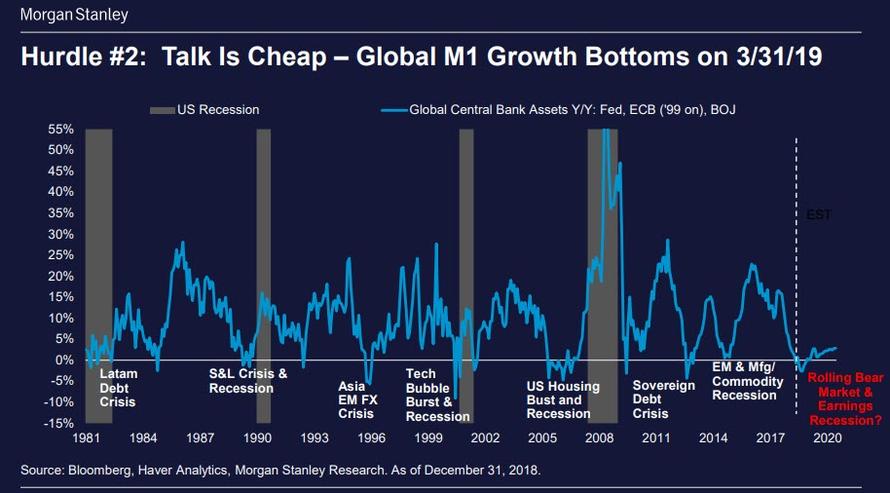
And just to confirm that the collapse in Global M1 growth is a major problem - perhaps the biggest for the global economy - Morgan Stanley showed the following chart which confirms that every time M1 has dipped negative - as central bank liquidity injection either slowed or went into reverse - there has been a financial crisis: whether the 2015 EM and Manufacturing Commodity Recession, the Sovereign Debt Crisis of 2011, the Global Financial Crisis and US Housing bubble burst of 2007/2008, the Tech Bubble burst of 2000 and so on.

So yes, there is little doubt that global growth is slowing the only question is how forcefully. Today, courtesy of BMO, we present another chart which shows that the world economy is as of this moment almost certainly in a recession.
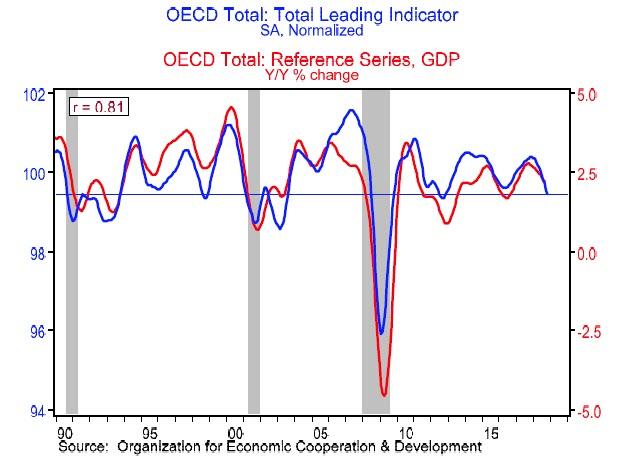
As economist Douglas Porter observes, the OECD’s leading indicator is a good guidepost of what is coming just around the corner, although it doesn’t lead broad GDP trends by much (perhaps a month or so). It was just released Monday, and dipped for the 11th month in a row—it peaked in December 2017—clearly signaling a cooldown.
What the chart clearly shows is that the last three cycles all ended when the leading indicator dropped to where it is now (even though there have also been two false signals in that timeframe—during the Asian crisis in 1998, and during the Euro crisis in 2012).
So the question what happens next will have to be answered by policymakers who have no choice but to try and push higher the blue line in the chart above. In other words, the fate of this cycle will be determined by how policymakers now respond, and how markets and consumer/business sentiment hold up in coming weeks.
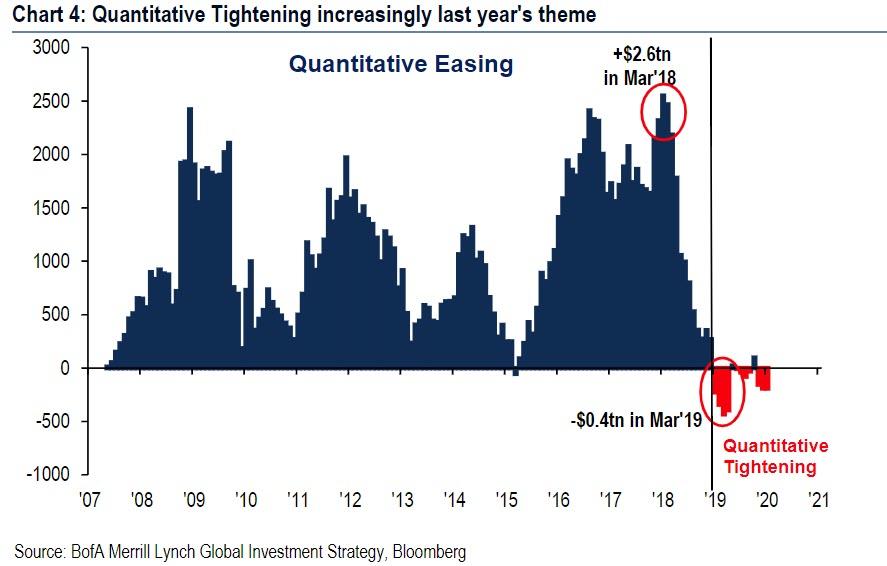
And since it is all up to central banks once again to boost liquidity, something they won't be doing during the current QT phase unless something drastically changes over the next 12 months...

... the above charts confirm that the key variable for the global economy is not whether the Fed stops hiking or starts cutting rates (although any further rate hikes will surely have an adverse impact on global liquidity), but whether the Fed - and other central banks - pause their balance sheet shrinkage, and once again start actively injecting liquidity into the global system, or soon enough we will be looking for the best description of "[insert here] crisis of 2019."

Tuesday, January 29, 2019

A.I. finds non-infringing ways to copy drugs pharma spends billions developing

Drug companies spend billions developing and protecting their trademark pharmaceuticals. Could artificial intelligence be about to shake things up? In a breakthrough development, researchers have demonstrated an A.I. which can find new methods for producing existing drugs in a way that doesn’t infringe on existing patents.
Called Chematica, the software platform does something called “retrosynthesis,” similar to the kind of reverse engineering that takes place when an engineer dissects an existing product to see how it works. In the case of Chematica, this process is based on a deep knowledge of how chemical interactions take place. It has around 70,000 synthetic chemistry “rules” coded into its system, along with thousands of additional auxiliary rules prescribing when particular reactions occur and with which molecules they’re compatible. An algorithm then inspects the massive number of possible reaction sequences in order to find another way to the same finish line.
“They effectively walk on enormous trees of synthetic possibilities, so it is a graph search problem they are trying to solve,” Bartosz Grzybowski at the Ulsan National Institute of Science and Technology (UNIST) in South Korea, told Digital Trends. “Akin to chess, every synthetic move these algorithms make is evaluated by scoring functions, which we developed over the years to tell the program whether it is navigating in the right synthetic direction.’”
The analogy to playing chess isn’t a frivolous one. Over the almost two-decades (!) that this work has been ongoing, the researchers have shown that the numbers of “positions” the A.I. must evaluate is similar to the number of possibilities that chess programs have to scrutinize.
“In principle, one can always argue that a human expert would also design this or that synthetic route,” Grzybowski continued. “That is absolutely possible given adequate amount of time, but Chematica does the job on typical timescales of [just a few minutes to one hour]. It’s like trying to multiple 468,383,83 x 25,405 with paper and pencil versus using a calculator.”
As exciting as the work is, however, don’t expect this to be anything that brings down the world of big pharma — if that’s what you’re hoping for. Chematica, which was bought by pharma giant Merck in 2017, is more likely to be used to help these companies better protect their intellectual property.
“[In our latest] paper we tackled three blockbuster drugs, very heavily guarded by patents — and yet a ‘stupid’ computer managed to find synthetic bypasses,” Grzybowski said. “Now, what if your competitors were to use such a tool? Could they bust your patents? Should you also use the tool? What if they come up with a better version? These sorts of question might point to an arms race in developing similar and competing software solutions.”
to hear the video visit: https://www.digitaltrends.com/cool-tech/ai-develop-drug-without-trademark/amp/

Monday, January 28, 2019

As China’s debt soars, the market for buying bad loans revs up

Where most see peril, a hardy few see profits

For many investors, debt in China is something to fear, a shadow over the world economy. But for a different breed, it looks more like a terrain of untapped profits. This dichotomy has been sharpened by a run of weak data in recent days. Worries about a sharp slowdown in China have rattled global markets. But for the opportunists, it is a time of plenty—a chance to snag assets from banks at a discount.
Both camps start from the same point. They see that debt in China has soared over the past decade and conclude that lending must be tamed. Yet there are clear economic downsides to doing so. Barely any progress has been made on reining in credit, but economic growth is already suffering. In the past few weeks business orders have declined, imports have fallen unexpectedly and weak price data have raised the spectre of deflation.
This, though, is where the small but hardy group of investors diverges from the mainstream gloom. To repair their balance-sheets, banks are under pressure to sell off failed loans, mostly channelling them through an array of state-owned “bad banks”. Outside buyers can then buy these assets and, with some work, earn good returns on them. Though they have little chance of collecting repayment from the original borrowers, they take possession of the collateral—almost always property—at knock-down prices.
It is a niche market, but, as with any product, the crucial variables are supply and demand, both of which have shifted in buyers’ favour. Chinese banks have long had plenty of lousy assets. They categorise more than 5% of their loans—nearly 5.6trn yuan ($830bn)—as either non-performing or “special mention”, meaning they might soon run into trouble. But they are now restructuring them at a faster clip to make room for the next wave. Last year they wrote off 988bn yuan in non-performing loans, up more than a third from 2017, according to official data. “They are preparing for tougher times ahead,” says Nicholas Zhu of Moody’s, a credit-rating agency. On top of that, regulators are getting stricter. They, for instance, now require that banks classify loans that are overdue for more than 90 days as non-performing, as is normal in developed markets.
On the demand side, buyers were, as recently as 2017, rushing to scoop up bad loans. Inexperienced investors such as peer-to-peer firms, flush with cash, thought they could turn an easy profit. They had not grasped the complexity of dealing with bad loans. “They were pricing them as if they could collect 100% of the market value of the collateral, which never happens in real life,” says Benjamin Fanger, founder of ShoreVest, a Guangzhou-based debt investor, and a rare veteran of China’s bad-loan market.
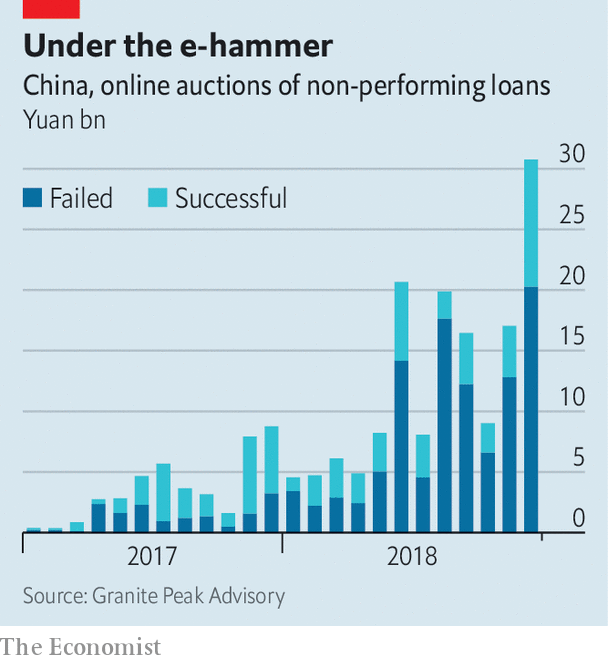
Many of these local investors have now exited. A bear market in stocks has dampened enthusiasm. And regulators have once again played a critical role, placing more restrictions on funds that invest ordinary savers’ cash. One measure of how fast the landscape has changed is the growing number of online bad-loan auctions that ended with no buyer. Though two-thirds of online auctions succeeded in 2017, just 41% did last year, according to Granite Peak Advisory, a consultancy based in New York (see chart).

At the same time a few big foreign firms have started dipping their toes in the water. Bain Capital, one of the world’s largest investors in alternative assets, has bought three portfolios of bad loans in China over the past two years, worth $650m in principal. Kei Chua, a managing director at the firm, recalls balking at the market in the early 2000s. It was so chaotic that several people would claim ownership of the same building. Times have changed: China now has, among other things, a system for checking claims on property. “It’s professional, it’s predictable,” he says. Given the amount of bad debt coming down the pipeline, at least the pipes themselves seem to be in reasonable shape.

Friday, January 25, 2019

Economists reconsider how much governments can borrow

The profession is becoming less debt-averse

In the last three months of 2018 America’s federal government borrowed $317bn, or about 6% of quarterly gdp. The deficit was 1.5 percentage points higher than in the same quarter the year earlier, despite the fact that the unemployment rate fell below 4% in the intervening period. In cash terms America borrowed in a single quarter as much as it did in all of 2006, towards the peak of the previous economic cycle.
Such figures might once have sent the country’s deficit scolds into conniptions. But scolds are in short supply, at least within the halls of Congress. Republicans were the architects of President Donald Trump’s budget-busting tax plan. Some Democrats are less content than ever to tie their hands with the fiscal rules that Republicans routinely flout. Early this year progressive Democrats urged Nancy Pelosi, the speaker of the House of Representatives, to abandon “paygo” rules, which require that new spending be paid for with matching tax increases or offsetting spending cuts.
Even more surprising is the reaction among economists. Heterodox schools of thought have long questioned the view that government spending must be paid for by taxes. “Modern monetary theory”, which synthesises such views, is proving increasingly popular among left-wing politicians. The charismatic new congresswoman from New York, Alexandria Ocasio-Cortez, is a fan.
Orthodox economists have traditionally been more cautious. “Government spending must be paid for now or later,” wrote Robert Barro, of Harvard University, in a seminal paper published in 1989. “A cut in today’s taxes must be matched by a corresponding increase in the present value of future taxes.”
Interest-rate wobbles once sent shock waves across Washington. In 1993 James Carville, a Democratic political adviser, mused that if reincarnation existed he wanted to come back as the bond market. “You can intimidate everybody,” he quipped. More recently Carmen Reinhart of Harvard University, Vincent Reinhart of Standish Mellon Asset Management and Kenneth Rogoff, a former chief economist of theimfnow at Harvard, have published research that argues that periods in which government debt rises above 90% of gdp are associated with sustained slowdowns in economic growth.
But government borrowing looks less scary than it used to, and some mainstream economists are reconsidering the profession’s aversion to debt. They once feared “crowding out”—that government bonds would lure capital that would otherwise finance more productive private-sector projects. But real interest rates around the world have been falling for most of the past 40 years, suggesting that there are too few potential investments competing for available savings, rather than too many. Indeed, government borrowing could “crowd in” new private investment. Public spending on infrastructure might raise the returns to private investment, generating more of it.
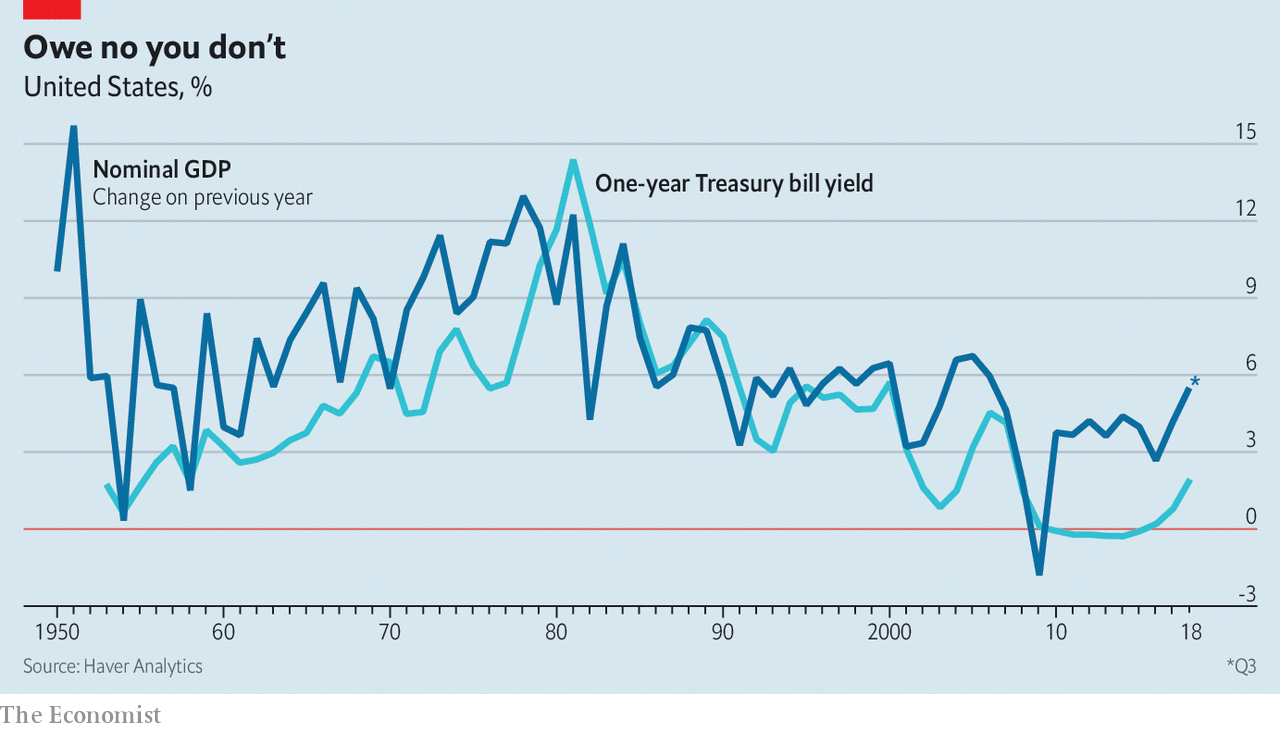
That still leaves bills to be paid. Yet here, too, things are less clear cut than one might suppose. The experience of Japan, where gross debt as a share of gdp exceeds 230%, suggests that even very high levels of debt may not scare away creditors, at least in advanced economies that borrow in their own currencies. And in a recent lecture Olivier Blanchard, another former chief economist of theimf, pointed out that when the pace of economic growth exceeds the rate of interest on a country’s debt, managing indebtedness becomes substantially easier. In such cases debt incurred in the past shrinks steadily as a share of gdp without any new taxes needing to be levied. Debt might nonetheless rise if annual deficits are sufficiently large, as they are in America now. Even so, at prevailing interest and growth rates and with deficits continuing to run at 5% of gdp, it would take more than a century for America’s ratio of gross debt to gdp to reach the current Japanese level.
Of course, interest rates could rise. But most commonly growth rates tend to exceed the rate of interest. Since 1870, Mr Blanchard noted in his lecture, the average nominal interest rate on one-year usgovernment debt has been 4.6%, while the average annual growth rate of nominal gdp has been 5.3%. Growth rates have surpassed interest rates in every decade since 1950, except the 1980s. Nicholas Crafts of the University of Warwick wrote that the difference between growth and interest rates did more to reduce British debt loads in the 20th century than budget surpluses. Indeed, austerity-induced deflation in the 1920s frustrated attempts to pay down war debts.
In a pinch, governments have tools to manage unwieldy debt burdens. Ms Reinhart and Belen Sbrancia, of the imf, noted that financial repression was a critical debt-reduction tool in the decades after the second world war. During this period inflation pushed real interest rates (ie, adjusted for inflation) into negative territory. This effectively imposed a tax on savers that, owing to restrictions on the movement of capital, could not easily be avoided. Repression is not costless; it limits the extent to which capital flows towards its most productive uses. But it is unlikely to be devastating for a mature modern economy.

Bonds away

Governments cannot borrow without limit. Whether or not creditors mind, a government can throw only so much cash at its citizens before their spending exhausts the economy’s productive capacity and pushes up prices at an accelerating pace.
Yet for much of the past decade politicians have stimulated economies too little. Rich countries have spent far more time below their productive capacity than above it—at grave economic cost. An overdeveloped fear of public debt, nurtured by economists, is partly to blame. But experience suggests that governments face looser budget constraints than once thought, and enjoy more freedom to support struggling economies than previously believed. Economists, happily, are taking note.

Thursday, January 24, 2019

Gold Price History from 30 B.C. to Today

Historical Gold Prices in the Roman Empire, Great Britain and the United States

Gold has been precious throughout history, but it wasn't used for money until 643 B.C. At first, people carried around gold or silver coins. If they found gold, they could get the government to make tradable coins out of it. This article tracks the price of gold from 30 B.C. to the gold rate today.

Roman Empire

Emperor Augustus, who reigned in ancient Rome from 30 B.C. to 14 A.D., set the price of gold at 45 coins to the pound.
In other words, a pound of gold could make 45 coins. The next revaluation occurred in the period of 211-217 A.D., during the reign of Marcus Aurelius Antoninus. He debased the value to 50 coins for a pound of gold, making each coin worth less and the price of gold worth more. From 284 A.D. to 305 A.D., Diocletian further debased gold to 60. Constantine the Great debased it to 70 in the years 306 A.D. to 337 A.D.  They did this to finance the military so they could stay in power. They also increased taxes.
These emperors lowered the value of the currency so much that it created hyperinflation. To give you an idea, in 301 A.D., one pound of gold was worth 50,000 denarii, which is another coin based on silver. By 337 A.D., it was worth 20 million denarii. As the price of gold rose, so did the price of everything else. Middle-class people could not afford their daily needs. That's one reason the Roman Empire began to crumble.

Great Britain

In 1257, Great Britain set the price of an ounce of gold at £0.89. It raised the price by about £1 each century, as follows:
  • 1351 - £1.34
  • 1465 - £2.01
  • 1546 - £3.02
  • 1664 - £4.05
  • 1717 - £4.25
In the 1800s, most countries printed paper currencies that were supported by their values in gold. This was known as the gold standard.
Countries kept enough gold reserves to support this value. The history of the gold standard in the United States began in 1900. The Gold Standard Act established gold as the only metal for redeeming paper currency. It set the value of gold at $20.67 an ounce.
Great Britain kept gold at £4.25 an ounce until the 1944 Bretton-Woods Agreement. That's when most developed countries agreed to fix their currencies against the U.S. dollar since the United States owned 75 percent of the world's gold. MeasuringWorth.com’s “The Price of Gold, 1257-Present” shows gold trend prices all the way back to the Middle Ages.

United States

The history of the gold standard in the United States began in 1900. The Gold Standard Act established gold as the only metal for redeeming paper currency. It set the value of gold at $20.67 an ounce. Before that, the United States used the British gold standard. In 1791, it set the price of gold at $19.49 but also used silver to redeem currency. In 1834, it raised the price of gold to $20.69. 
Defense of the gold standard helped cause the Great Depression. A recession began in August 1929, after the Federal Reserve raised interest rates in 1928. After the 1929 stock market crash, many investors started redeeming paper currency for its value in gold.
 The U.S. Treasury worried that the United States might run out of gold. It asked the Fed to raise rates again. The rise in rates increased the value of the dollar and made it more valuable than gold. It worked in 1931.
Higher interest rates made loans too expensive. That forced many companies out of business. They also created deflation, since a stronger dollar could buy more with less. Companies cut costs to keep prices low and remain competitive. That further worsened unemployment, turning the recession into a depression. 
By 1932, speculators again turned in money for gold. As gold prices rose, people hoarded the precious metal. They sent prices up even higher. To stem the redemption of gold, President Franklin D. Roosevelt outlawed private ownership of gold coins, bullion, and certificates in April 1933.
Americans had to sell their gold to the Fed.
In 1934, Congress passed the Gold Reserve Act. It prohibited private ownership of gold in the United States. It also allowed President Roosevelt to raise the price of gold to $35 an ounce. This lowered the dollar value, creating healthy inflation. 
In 1937, FDR cut government spending to reduce the deficit. This reignited the Depression. By that time, the government stockpile of gold tripled to $12 billion. It was held at the U.S. Bullion Reserves at Fort Knox, Kentucky and at the Federal Reserve Bank of New York.
In 1939, FDR increased defense spending to prepare for World War II. The economy expanded. At the same time, the Dust Bowl drought ended. The combination ended the Great Depression. 
In 1944, the major powers negotiated the Bretton-Woods Agreement. That made the U.S. dollar the official global currency. The United States defended the price of gold at $35 an ounce.
In 1971, President Nixon told the Fed to stop honoring the dollar's value in gold. That meant foreign central banks could no longer exchange their dollars for U.S. gold, essentially taking the dollar off the gold standard. Nixon was trying to end stagflation, a combination of inflation and recession. But inflation was caused by the rising power of the dollar, as it had now replaced the British sterling as a global currency.
Nixon tried to deflate the dollar's value in gold, by making it worth only one-thirty eighth of an ounce of gold, then one-forty second of an ounce. In 1976, Nixon officially abandoned the gold standard altogether. Unhinged from the dollar, gold quickly shot up to $120 per ounce in the open market.
By 1980, traders had bid the price of gold to $594.92 as a hedge against double-digit inflation. The Fed ended inflation with double-digit interest rates but caused a recession. Gold dropped to $410 an ounce and remained in that general trading range until 1996 when it dropped to $288 an ounce in response to steady economic growth. But traders returned to it after each economic crisis, such as the 9/11 terrorist attacks and the 2001 recession.
Gold shot up to $869.75 an ounce during the 2008 financial crisis. The price of an ounce of gold hit an all-time record of $1,895 on September 5, 2011, in response to worries that the United States would default on its debt. Since then, it has fallen, as the U.S. economy has improved and inflation remains low.
Because people want a safe haven when an economic crisis hits, they wonder “Should I buy gold?” To answer this, one must know what causes gold prices to rise and fall before investing in this asset.    

Gold Price by Year Compared to the Dow, Inflation and Business Cycle Phases


Year Gold Prices (London PM Fix)Dow Closing (Dec 31)Inflation (Dec YOY)Factors Influencing Price of Gold
1929$20.63248.480.6%Recession.
1930$20.65164.58-6.4%Deflation. 
1931$17.0677.90-9.3%Depression
1932$20.6959.93-10.3%Depression
1933$26.3399.900.8%FDR takes office. 
1934$34.69104.041.5%Expansion. Gold Reserve Act.
1935$34.84144.133.0%Expansion.
1936$34.87179.901.4%Expansion.
1937$34.79120.852.9%FDR cut spending.
1938$34.85154.76-2.8%Contraction until June. 
1939$34.42150.240%Dust Bowl drought ends.
1940$33.85131.130.7%Expansion.
1941$33.85110.969.9%U.S. enters WWII.
1942$33.85119.409.0%Expansion.
1943$33.85135.893.0%Expansion.
1944$33.85152.322.3%Bretton-Woods Agreement. 
1945$34.71192.912.2%Recession follows WWII.
1946$34.71177.2018.1%Expansion.
1947$34.71181.168.8%Expansion.
1948$34.71177.303.0%Expansion.
1949$31.69200.13-2.1%Recession.
1950$34.72235.415.9%Expansion. Korean War.
1951$34.72269.236.0%Expansion.
1952$34.60291.900.8%Expansion.
1953$34.84280.900.7%Eisenhower ends Korean War. Recession. 
1954$35.04404.39-0.7%Contraction ends in May. Dow returns to 1929 high.
1955$35.03488.400.4%Expansion.
1956$34.99499.473.0%Expansion.
1957$34.95435.692.9%Expansion until August. 
1958$35.10583.651.8%Contraction until April.
1959$35.10679.361.7%Expansion. Fed raises rate.
1960$35.27615.891.4%Recession. Fed lowers rate.
1961$35.25731.140.7%JFK takes office.
1962$35.23652.101.3%Expansion. 
1963$35.09762.951.6%LBJ takes office.
1964$35.10874.131.0%Goldfinger depicts plan to control Fort Knox gold.
1965$35.12969.261.9%Vietnam War.
1966$35.13785.693.5%Expansion. Fed raises rate.
1967$34.95905.113.0%Expansion.
1968$38.69943.754.7%Expansion. Fed raises rate.
1969$41.09800.366.2%Nixon took office. Fed raises rate.
1970$37.44838.925.6%Recession. Fed lowers rate.
1971$43.48890.203.3%Expansion. Wage-price controls. 
1972$63.911020.023.4%Expansion. Stagflation.
1973$106.72850.868.7%Gold standard ends. 
1974$183.85616.2412.3%Watergate. Ford allows private ownership of gold.
1975$139.30852.416.9%Recession ends. Stocks rise, gold falls.
1976$133.881004.654.9%Expansion. Fed lowers rate.
1977$160.45831.176.7%Expansion. Carter takes office.
1978$207.83805.019.0%Expansion. 
1979$455.08838.7113.3%Fed's stop-go policy worsens inflation.
1980$594.92963.9912.5%Gold hits $850 on 1/21. Investors seek safety.
1981$410.09875.008.9%Gold Commission. 
1982$444.301,046.543.8%Recession ends. Garn-St. Germain Act. 
1983$389.361,258.643.8%Expansion. Reagan increases spending. 
1984$320.141,211.573.9%Expansion.
1985$320.811,546.673.8%Expansion.
1986$391.231,895.951.1%Expansion. Reagan tax cuts.
1987$486.311,938.834.4%Expansion. Black Monday crash. 
1988$418.492,168.574.4%Expansion. 
1989$409.392,753.204.6%S&L Crisis. 
1990$378.162,633.666.1%Recession.
1991$361.063,168.833.1%Recession ends. 
1992$334.803,301.112.9%Expansion.
1993$383.353,754.092.7%Expansion.
1994$379.293,834.442.7%Expansion.
1995$387.445,117.122.5%Expansion.
1996$369.006,448.273.3%Expansion. Investors turn to stocks.
1997$288.747,908.251.7%Expansion.
1998$291.629,181.431.6%Expansion.
1999$282.3711,497.122.7%Expansion. Y2K scare.
2000$274.3510,786.853.4%Stock market peaks in March.
2001$276.5010,021.51.6%Recession. 9/11.
2002$347.208,341.632.4%Expansion. 9-year gold bull market starts.
2003$416.2510,453.921.9%Expansion.
2004$435.6010,783.013.3%Expansion.
2005$513.0010,717.503.4%Expansion.
2006$632.0012,463.152.5%Expansion.
2007$833.7513,264.824.1%Dow peaks at 14,164.43.
2008$869.758,776.390.1%Recession.
2009$1,087.5010,428.052.7%Recession ends. Gold hits $1,000/oz. on 2/20.
2010$1,405.5011,577.511.5%Obamacare and Dodd-Frank.
2011$1,531.0012,217.563.0%Debt crisis. Gold hits record $1,895 on 9/5.
2012$1,657.6013,104.141.7%Expansion. Gold falls. Stocks rise.
2013$1,202.3016,576.551.5%
2014$1,154.2517,823.070.8%Strong dollar. 
2015$1,061.0017,425.030.7%Gold falls to $1,050.60 on 12/17.
2016$1,150.9019,762.602.1%Dollar weakens. 
2017$1,302.5024,719.222.1%Dollar weakens. 
2018$1,281.6523,327.46N.A.Dollar strengthens.

Note: Between 1929 and 1969, annual average gold prices are used. In 1970, December monthly gold price averages are used 1920 to 1999. Last business day of December is used for 2000 on.