About Me

My photo
An Investor and counsellor in Financial Market

Tuesday, January 09, 2018

Can Blockchain Bring An End To Corruption?

The Roman historian Tacitus once famously quipped “the more corrupt the state, the more numerous the laws”.
Every year, roughly 2 percent of global GDP is lost to public sector corruption alone – at a hefty $2 trillion this equals to Italy’s GDP.
The total cost of corruption stands even higher, at 4-5 percent of global GDP. Countries across all continents lose substantial parts of their budgets to corruption. Some African nations see up to a third of their budgets go down the corruption drain.
After thousands of years of fighting against corruption, blockchain might just be the answer everyone was searching for.
In Africa, where contract procedures are either non-existent or highly opaque (and can lead to the most unpredictable outcomes), Blockchain can streamline business deals by rendering the manifold middlemen obsolete.
In Latin America, where changes to public registries are impossible to track, hence by virtue of a hefty bribe land parcels might discreetly change hands in a matter of minutes, blockchain could sanitize whole clusters of corrupt public authorities.
But it’s not solely confined to developing countries – numerous Western conglomerates routinely hand out bribes to lock in deals, just as politicians regularly represent the interests not only of their constituents.

Blockchain seems to be on the verge of radically transforming the way we vote and our trust in the ballot: We would no longer need to stand in queues and be physically present at the ballot box—we could simply vote from home, or anywhere at all. More importantly, by creating immutable ledgers, blockchain would make it impossible to tamper with our votes – proxy voting, ballot destruction and ballot stuffing would become mere anachronisms. This would also alter people’s perception of political power. Now, around a third of voters in both developed and developing countries do not trust the outcome of elections. If voters were given a fully transparent voting process, trust in public authorities would rise.
Some countries are already taking their first steps in this direction. The city of Moscow intends to use blockchain in a city management platform where inhabitants could track voting on city projects in real time. From there, it takes only one step to implement it in nationwide voting mechanisms. And from there, just one step to implementing transparency across myriad political processes that are in everyone’s best interest.
Increased transparency in political processes reduces the risk of tax evasion, thanks to which the risk that short-received government revenues will be rerouted from investments in infrastructure or education towards to band-aiding state finances ought to be nullified.
“We understand that the assimilation of blockchain-based voting technology and disintermediated governance tools will take place at variable speed,” Rik Willard, CEO of Global Blockchain Technologies Corp. (TSX.V:BLOC), told Oilprice.com.
BLOC is hoping to radically confine the space for corruption by eliminating unnecessary intermediaries and rendering political processes as transparent as ever, and as Willard says: “We are ready for that and intend to spearhead this much-needed transformation.”
Blockchain-based voting mechanisms would ultimately lead to the demise of dictatorships which maintain the superficial appearance of a democracy – decentralized technology is the exact opposite of what repressive regimes can survive under.
Of course, military dictatorships would steer clear of blockchain: It is very difficult to imagine North Korea, for instance, having a go at it. Yet the manifold quasi-democratic countries which exteriorly hold regular elections, claim to follow market mechanisms and hold democratic ideals dear will be forced to become more transparent under the weight of blockchain technologies.
Documents will be no longer owned by one single party and stored on a single server; document forgery would not be validated due to consensus protocol. Russia is a pertinent case in point as applying blockchain in a society where corruption has pervaded all spheres of life will bring palpable results in the very near future, to the surprise of many.
Evidence shows that the implementation of blockchain mechanisms can not only cleanse a given country’s political system, but could also spur economic growth.
Should public land registries across Africa be made fully transparent, land might be used as collateral for loans, thereby allowing millions of entrepreneurial Africans to leverage their property. This is supported by academic evidence; namely, that any reduction in corruption levels bolsters domestic and foreign investment as the fears of economic actors that the allocation of resources is disproportionally skewed gradually subside.
International organizations might also put blockchain to good account.
The international football association, FIFA, has been bogged down in myriad scandals with regard to its decision-making mechanisms. With blockchain, voting procedures would be as transparent as crystal, massively narrowing down the potentiality of another bribery scandal.
Even greater gains could be attained in international aid, the sphere where misappropriation reached its full zenith. Blockchain would allow to track down all financial transactions which followed the assignment of humanitarian or development aid – this is sorely needed as the history of World Bank development loans is replete with stories when the allocated funds were misused by a third-world country tribe chief to build a football stadium even though the declared objective was to build a school or hospital.
Some might perceive blockchain as a direct threat to the way governments exist nowadays, yet one could hardly find a better tool to dramatically increase the efficiency of public authorities with little to no transition roadblocks.
Big banks and major corporations are already taking advantage of this technology.
At the center of the blockchain boom in banking is the R3 Consortium. Since its inception in 2014, the consortium has been joined by a number of the world’s top banks, including Goldman Sachs, JP Morgan, and Citi. In addition to its impressive list of members, the consortium is also partnered with the likes of Microsoft, Intel, HP and InfoSys.
Immutability of data and process transparency will become key concepts of the 21st century and blockchain will prove that our past understanding of transparency was just a pale version of what can be achieved. As demonstrated by Global Blockchain Technologies, moving towards blockchain is not a question of ‘if’--rather of ‘when’ – and that ‘when’ will happen very soon.

Monday, January 08, 2018

What Bitcoin Alternative Can Be Mined at Home?

Bitcoin’s underlying technology has paved the way for numerous alternative cryptocurrencies. Although Bitcoin remains the most popular, there are others that have also performed really well during this past year. These alternative cryptocurrencies are called altcoins, and their arrival onto the scene is based on new funding mechanism called initial coin offerings (ICOs).
One of the best alternatives for Bitcoin is Ethereum (ETH), which is a decentralized software platform that enables Smart Contracts and Distributed Applications to be built and run without any downtime, fraud, control or interference from a third party. Ethereum has a market capitalization of $41.4 billion, second after Bitcoin among all cryptocurrencies.
Litecoin is often called the silver to Bitcoins gold and is also available for a much lower price than Bitcoin and Ethereum. One feature that is really useful in the case of Litecoin, is that it allows consumers who need a large number of small transactions to have these transactions processed extremely quickly. Litecoin has a market capitalization of around $17.8 billion.
IOTa is emerging as a new hot cryptocurrency in the market, mostly because of its non-traditional technology. Instead of blockchain, IOTa uses directed acyclic graph (DAG) technology. This system enables transactions to be free regardless of the size of the transaction. It also allows for fast confirmation times, it can handle unlimited simultaneous transactions, and the system can easily scale. IOTa has a market capitalization of around $10.4 billion.
Monero (XMR) is also an interesting cryptocurrency, mainly because its transactions are completely private and untraceable. This means that transactions cannot be linked to a particular user, distinguishing Monero from other cryptocurrencies. Monero has a market capitalization of $1.49 billion.
Ripple (XRP) is also popular, although it doesn’t require mining, which makes it different from Bitcoin and other altcoins. It was released in 2012, offering instant, certain and low-cost international payments. Ripple has a market capitalization of $1.26 billion.
There are, of course, many other altcoins, but these five are the most legitimate and probably safer than others.

Friday, January 05, 2018

Belarus just legalized bitcoin and granted miners tax exemption – here’s why

As much of Europe prepared to party, Belarus began its festive season with a flurry of blockchain- and bitcoin-related activity, legalizing cryptocurrency-related activities with immediate effect. Bitcoin mania has made it to Minsk – and is showing no signs of slowing down as 2018 approaches.
Detractors may claim that the landlocked former Soviet state is somewhat late to the game – in spring this year, neighbor Ukraine struck a blockchain deal with Bitfury that the latter’s CEO called “probably the largest of its kind anywhere.”
However, Belarus’ sudden fervor to throw its lot in with blockchain and bitcoin is notable for its exceptionally wide scope. Long-serving president Aleksandr Lukashenko (who once called the internet “a pile of garbage”) has effectively kicked open the doors to a whole range of domestic and overseas blockchain and cryptocurrency operations.

Minsk’s moves

On December 22, he unveiled a range of surprising legal measures to a meeting of business representatives, saying, “Belarus will become the first state in the world to open up broad opportunities for the use of blockchain technology. We have every opportunity to become a regional center of competence in this field.”
As part of the package, the country has legalized the use of smart contracts, claiming that it is the first state in the world to do so. Indeed, any company working on smart contract development will now be exempt from paying income tax until 2023.
Cryptocurrency pioneers also have reason to sit up and take note – Lukashenko’s decree not only legalizes initial coin offerings (ICOs), but has also offered full, legal, tax-free status to all token issuance, digital currency trading and mining enterprises for the next five years.
Companies will also be allowed to work under what it terms “English law,” presumably meaning overseas crypto-related companies can sidestep Belarus’ often-suffocating, Soviet-era bureaucracy.

Park life

The Minsk government is no doubt hoping that its new High-Tech Park will rival Kazakhstan’s Astana International Financial Center, which has seen the likes of Deloitte and Waves team up with Kazakh and other CIS companies in an attempt to provide region-wide blockchain solutions.
In fact, it looks like almost anything goes at Belarus’ High-Tech Park. The head of the National Bank says the government will be “okay” with cryptocurrencies being used for international transactions at the park, and has even mooted the idea of launching a national digital currency.
Overseas IT experts now require no visa for stays of up to 180 days in Belarus, and VAT will not be payable for anyone transferring ownership rights, either to individuals or to overseas organizations.
Experts all around the CIS region have spent much of the festive season and the lead-up to the New Year trying to discover the rationale behind Minsk’s largely unexpected move. Russia’s Rambler quotesAlexander Chekan, venture partner of the Haxus Foundation, who claims that the both Belarus’ National Bank and its stock exchange are now conducting blockchain pilots.
Chekan also claims that Minsk’s laissez-faire attitude to the High-Tech Park will lead to “more corporations setting up R&D operations in the country, and an influx of start-ups and funding from other countries where blockchain regulations are stricter.”
Earlier this year, Chekan told reporters that Belarus’ banking and tax systems also needed “the ability to work with the most modern payment tools, ranging from PayPal to bitcoin.”

“Europe’s last dictator”

So where did Belarus’ sudden fervor for all things crypto and blockchain-related come from?
Belarus’ regime is notably guarded about most of its policy decision, and Lukashenko, known as “Europe’s last dictator” (and the longest-serving head of state on the continent) is known to keep his cards very close to his chest.
However, one of Belarus’ leading cryptocurrency advocate, businessman Viktor Prokopenya, has been meeting with Lukashenko since early this year and appears to have won the president’s confidence on cryptocurrency matters. The latter’s head was apparently turned after a visit to Prokopenya’s offices back in March.
Prokopenya even addressed the Minsk parliament last week, saying, “Belarus wants to be an IT capital for the Slavic world like Hong Kong. In times of sanctions and political instability at our borders, this is more urgent than ever.”
Indeed, Prokopenya’s mention of borders is telling – in addition to Ukraine’s blockchain operations, Russian counterpart Vladimir Putin has developed a keen interest in cryptocurrenies in 2017. The Kremlin chief has met with Ethereum founder Vitalik Buterin, while plans are afoot to create a “Bitcoin City” near the Chinese border.
Other former CIS states have pressed ahead with blockchain technology projects and crypto ventures that look like they are already bearing fruit, particularly the Baltic States to the west and Kazakhstan and Georgia to the south. Belarus has been the odd-one-out – a status it is looking to rectify with remarkable alacrity.

What’s in store for 2018?

Cryptocurrency is now enjoying a spectacular rise in popularity in the country. BNTU, Belarus’ biggest technical university, has begun offering degree courses in Cryptocurrencies and Derivatives, with scores of people rushing to submit their applications.
Leading Belarusian bankers are expressing a keen interest in the central bank’s tentative plans for a national digital currency. Belgazprombank’s deputy chairman states, optimistically, “If [the Belarusian government] feels that a national digital currency would genuinely be of benefit, the potential is there to release it relatively quickly.”
Belarus did not even feature on Forbes’ 2017 list of the Best Countries for Business – although there were places for neighbors and rivals such as Russia (58), Moldova (87) and Ukraine (80). Russian news site Sputnik claims, “Most likely, Forbes did not even consider evaluating Belarus when it was drawing up its list.” Hopes are high that all this will change if overseas companies take note of Belarus’ cryptocurrency and blockchain technology policy announcement.
Indeed, as Russia and Ukraine, Belarus’ closest frenemies, appear to dither over their crypto policy, Minsk will hope it has stolen a march on Moscow and Kiev in one key area – legislation. It is a surprising move, and one that may yet reshape the entire CIS region’s financial landscape.

Thursday, January 04, 2018

Will America’s economy overheat in 2018?

The labour market is the healthiest it has been for at least a decade. But inflation remains low
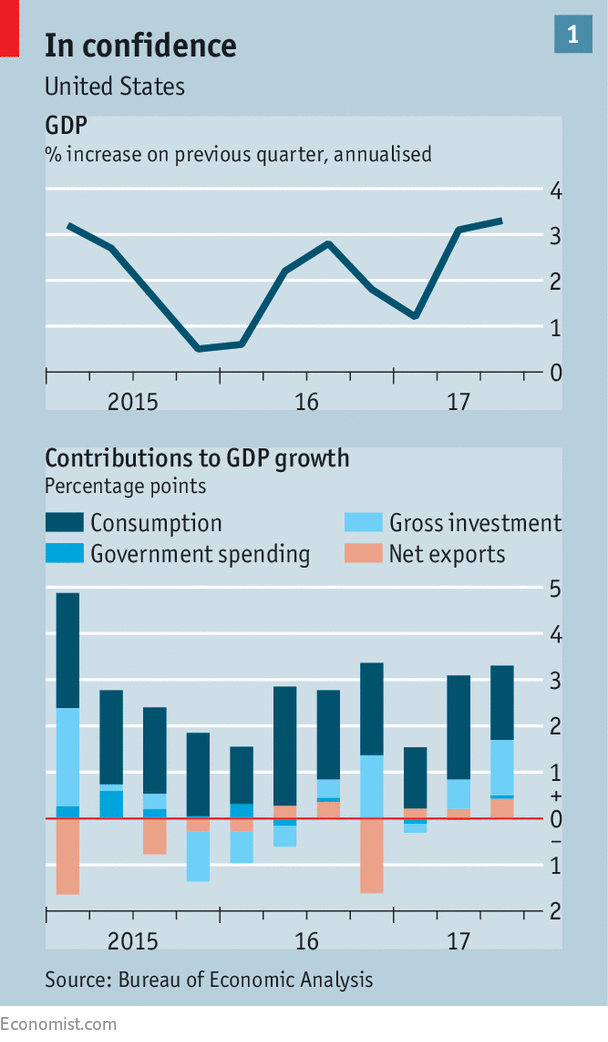
USUALLY politicians pretend that good economic news on their watch is no surprise. But America’s recent growth figures have been so positive that even the administration of President Donald Trump has allowed itself to marvel. “It’s actually happening faster than we expected,” mused Mick Mulvaney, the White House budget chief, in September, after growth rose to 3.1% in the second quarter. (Mr Trump in fact came to office promising 4% growth, but the goal now seems to be 3%.) Mr Mulvaney warned that hurricanes would soon bring growth back down. Instead, in the third quarter, it rose to 3.3%—a figure celebrated with more conviction. The administration’s initial caution was wise: quarterly growth figures are volatile, and few economists expect growth above 3% to carry on for long. Yet there is no denying that the economy is in rude health.
In part, that reflects the strength of the global economy. But it is also the culmination of a years-long trend. As politics has consumed America’s attention for the past two years, common complaints from earlier in the decade have, one by one, begun to look dated. The median household income is no longer stagnant, having grown by 5.2% in 2015 and 3.2% in 2016, after adjusting for inflation. During those two years, poorer households gained more, on average, than richer ones. Business investment is no longer tepid: it drove growth in the third quarter of the year (see chart 1). Jobs are plentiful—unemployment is just 4.1%. From Wall Street to Main Street, businesses ooze confidence. What is more, tax cuts are poised to stimulate the economy. Analysts no longer ask when growth will at last pick up. Instead, they wonder if the economy might overheat.
The Federal Reserve is alert to the risk. On December 13th it announced its third interest-rate rise this year, and the fifth during this economic expansion, taking rates to 1.25-1.5%. The median forecast of the Fed’s rate-setting committee is for three more rate rises in 2018. Not a single rate-setter thinks that today’s low rate of unemployment is sustainable. Yet all predict that joblessness will fall further in 2018.
The Fed is right to fret. Credible forecasters are almost unanimous: the sustainable rate of growth, as America’s population greys, is closer to 2% than to 3%, whatever Mr Trump says. In the past three months the economy has created an average of 170,000 jobs per month. Yet over the decade to 2026 the population of 20-64-year-olds will, on official projections, grow by fewer than 50,000 a month. Joblessness cannot fall for ever, so, unless productivity accelerates, growth must fall. If the Fed keeps money too loose, inflation will eventually rise, as the economy gets too hot.
Households seem exuberant. In October the University of Michigan’s consumer-sentiment index hit its highest level since 2004. Recent consumption growth has been fuelled by a steep fall in household saving, which is down from over 6% of GDP two years ago to just 3.2% today. In early 2016 some analysts fretted that consumers were squirrelling away the money they were saving on cheap petrol, and so denying the economy a needed fillip. Today, the opposite worry seems more pertinent: oil prices have recovered somewhat, but the saving rate has tumbled.
Falling saving is a worry, but consumers’ cheer is well-rooted in the buoyancy of the labour market and the strength of household balance-sheets. With interest rates low, debt-service costs, as a share of after-tax income, are close to a record low. Most American mortgages bear fixed interest rates, so homeowners are shielded from higher rates. And house prices have been rising, too. In the third quarter of 2016 they passed their peak of 2007. Since then, they have risen by another 6.3%.
Rich pickings
Higher house prices and a stockmarket boom have delivered a wealth windfall. Households and non-profit organisations now hold assets worth nearly seven times their after-tax income, the highest ratio on record. Middle-earners have seen the biggest gains, according to a recent Fed survey. The average net worth of households in the middle quintile of the income distribution (ie, from the 40th to the 60th percentile) rose by 34% between 2013 and 2016. House prices have recovered despite strict lending regulations introduced after the financial crisis. Mortgages remain difficult for those with poor credit scores.
Politics has helped business confidence. Optimism surged among small firms after Mr Trump won the election. On December 5th, days after the Republicans’ tax bill passed in the Senate, confidence among chief executives reached its highest level for nearly six years, says Business Roundtable, a lobby group. The prospect of a big cut to corporate taxes (and, perhaps, of deregulation) has boosted a stockmarket already on a long winning run. From the market trough in March 2009 to Mr Trump’s election, the S&P 500 rose at an average annual pace of 16%. Since his victory, it has grown at a 22% annualised pace.
A booming stockmarket pleases investors, but it poses another conundrum for the Fed. Some rate-setters worry that loose monetary policy may inflate asset bubbles. And soaring stocks have contributed to a general loosening of financial conditions. The dollar is about 7% weaker, on a trade-weighted basis, than it was at the start of the year. Long-term bond yields have also fallen slightly, having surged after the election. William Dudley, president of the New York Fed, has argued that looser financial conditions strengthen the case for interest-rate rises, because it is by influencing financial markets that monetary policy is supposed to work. According to analysis by Goldman Sachs, financial conditions have actually eased after every instance of Fed tightening since it started raising rates in December 2015.
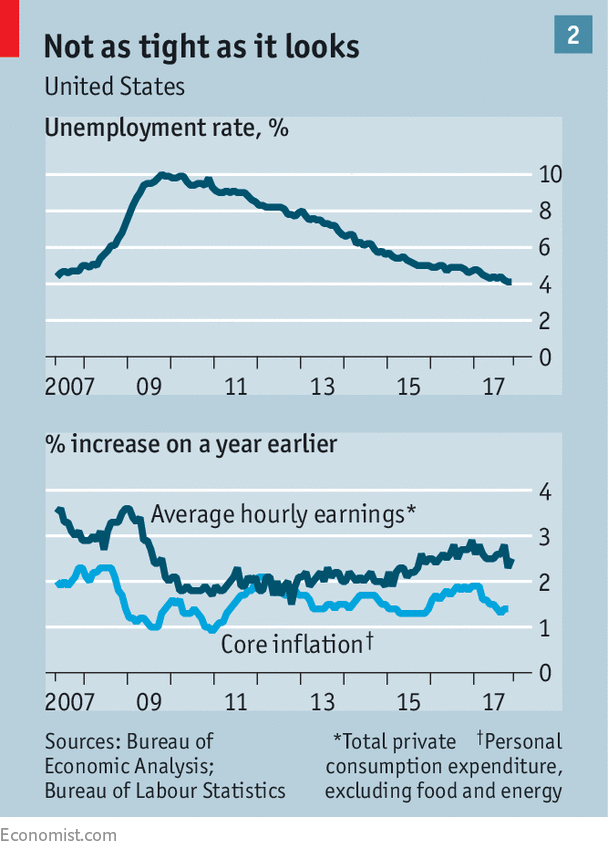
A crucial element is missing, however, from the “overheating” analysis: inflation. Since the spring, it has persistently fallen short of expectations. Excluding food and energy, prices in October were only 1.4% higher than a year earlier, by the Fed’s preferred measure. Wages, too, do not reflect the apparent strength of the labour market (see chart 2). Though blue-collar and service workers are seeing higher pay rises—the wages and salaries of production workers grew at a 3.8% annualised pace in the third quarter of the year—professionals have seen their pay growth slow. Overall, wages are rising by about 2.5%, no faster than two years ago.
One reason is the time it takes for low unemployment to translate into inflation. In the meantime, one-off factors can distort the data. Ms Yellen points to price cuts for mobile-phone contracts at the start of the year. These should soon drop out of the numbers. Others blame the “Amazon effect”—brutal price wars among retailers. Perhaps, too, the Phillips curve—the relationship between inflation and unemployment—is jagged, and inflation will suddenly spike once joblessness falls too low.
Or perhaps the labour market is not as hot as the Fed thinks. Estimates of the so called “natural” rate of unemployment—the rate consistent with no upward or downward pressure on inflation—are notoriously unreliable. Rate-setters have gradually revised theirs down, from over 5% at the end of 2013 to 4.6% today. Persistent low inflation may force them to repeat the trick. In any case, notes Michael Pearce of Capital Economics, a consultancy, the Fed’s surveys suggest the labour market is not as tight as it was in, say, mid-2000, when unemployment fell as low at 3.8%. Even in that expansion, underlying inflation did not hit 2%. The boom ended not because of an inflationary surge, but because the dotcom bubble burst.
Moreover, unemployment is not the only variable to watch. It does not count those who are not looking for a job. During and after the crisis, Americans left the workforce in droves. But since late 2015 the labour-force participation of working-age people, especially women, has been rising. For much of 2016, this trend kept unemployment fairly flat even as the economy added jobs aplenty. Though unemployment has fallen in 2017, working-age participation has kept on rising.
Sceptics doubt whether participation is tightly linked to the economic cycle. They point out that some trends, such as falling participation among working-age men, are very long-running. But participation is at least tricky to forecast. Its recent growth has defied official projections produced by the Bureau of Labour Statistics (BLS).
Whether that continues will set the economy’s speed limit. The Economist has calculated that, if participation in every age and sex demographic group continues on its trend from the past year, the labour force will grow by around 135,000 workers a month. At recent rates of job growth, unemployment would fall to 3.8% by the end of 2018. But should participation revert to the long-term trend forecast by the BLS, only 86,000 new workers will appear each month. Unemployment would fall much faster next year, to 3.4%.
The Fed’s rate rises will probably slow job growth before these hypotheses can be tested. Frustrated doves think the central bank should probe the boundaries of the labour market, and not assume it knows them in advance. It risks denying workers the first truly tight labour market in over a decade. Moreover, only if wage growth is allowed to rise will firms be pressed to invest more in labour-saving technology. This could raise productivity growth, revealing more hidden capacity. (Rising investment and a hint of a productivity rebound this year suggest such a process may be about to kick off.) And if the Fed tightens too quickly, sparking a recession, it may be hard to reverse course, since interest rates cannot fall far before hitting zero.
As evidence that rate-setters are fretting needlessly about inflation, doves point to the bond market. That long-term bond yields have fallen even as the Fed has raised rates suggests investors think the risk of inflation is shrinking. Ms Yellen’s retort is that inflation expectations, as measured by surveys, have held steady this year. That suggests something else could be pushing bond yields around.
Soon a new Fed chairman will be confronting these puzzles. Jerome Powell is to succeed Ms Yellen in February. Mr Powell, who has served as a Fed governor since 2012, has broadly supported Ms Yellen’s strategy of gradual rises in interest rates. In a confirmation hearing before a Senate panel on November 28th, he seemed, if anything, a little more doveish, acknowledging that low labour-force participation among working-age men might indicate remaining slack in the labour market.
Yet the Fed committee is turning over rapidly, and Mr Powell may find himself surrounded by hawks. An example is Marvin Goodfriend, whom Mr Trump has nominated to fill one vacant seat. Mr Goodfriend has for years called for higher rates, prematurely sounding the alarm about inflation as early as 2010. In 2012 he described as “doubtful” the notion that the Fed could bring unemployment down to 7%. When Ms Yellen departs, Mr Trump will have another three seats to fill. Moreover, voting rights rotate among regional Fed presidents, whom the president does not pick. Three doves—Charles Evans from Chicago, Neel Kashkari from Minneapolis, and Robert Kaplan from Dallas—will lose their votes in January, to be replaced by more hawkish voices. A fourth dove, Mr Dudley, plans to retire in 2018. His new colleagues may test Mr Powell’s commitment to continuing Ms Yellen’s approach.
The Fed must also decide how to respond to Mr Trump’s tax cuts. Even if the economy is not on the edge of overheating, these are poorly timed. Were stimulus warranted now, the Fed could always cut rates, avoiding the higher public debt that fiscal stimulus incurs. Tax cuts might spur some investment and raise growth by a few tenths of a percentage point in the short term. But they are also likely to nudge the Fed towards faster rate rises. The central bank’s economic model suggests that for every 1% of GDP in tax cuts, rates will eventually rise by 0.4 percentage points. The bill that passed the Senate on December 2nd would raise deficits by 0.2% of GDP in 2018 and 1.1% of GDP in 2019, not counting its effect on work and investment incentives.
Policymakers in recent years have tended to show too much caution, rather than too little. That is why a full recovery from the financial crisis has taken so long; it is in part why inflation is too low today. It seems likelier that they will err on the side of caution than allow the economy to run too hot. But America’s policy debate is finely poised. As the economy approaches its capacity, the margin for error shrinks.

Tuesday, January 02, 2018

New IMPACT Buy: The Next Great Bull Market in Gold Has Begun

A new long-term secular bull market in gold has begun. This new trend will take gold past $1,400 per ounce by the end of 2018, past $4,000 per ounce by 2020 (if not sooner) and ultimately to $10,000 per ounce or higher by the mid-2020s.
This bull market actually began on Dec. 17, 2015, when the dollar price of gold sank to $1,051 per ounce. This new bull market was two years old last weekend.
That’s OK. Bull markets begin slowly, almost unnoticed in the gloom of the prior bear market. The biggest gains often come after a few years when the crowd catches on and the price action gains momentum.
This new bull market in gold is the real deal and should last until 2028 or beyond. The moves so far have been relatively small compared with what’s ahead. This is the perfect time to make your allocation to physical gold, gold mining shares and gold royalty companies or “streamers.”
The last secular bull market began on Aug. 25, 1999, when gold bottomed at $252 per ounce. From there it began a spectacular 12-year run until peaking at just under $1,900 per ounce on Sept. 2, 2011.
The 1999–2011 bull market represented a 655% gain over the starting price, easily outpacing stocks, bonds, emerging markets and other competing asset classes.
September 2011 marked the start of a brutal four-year bear market, with gold finally bottoming at $1,051 per ounce. Unfortunately, that bear market included a lot of head fakes and bear traps along the way.
Gold managed a 13% rally from around $1,580 to $1,780 per ounce in the late summer and early fall of 2012. It also managed another 15% rally from $1,200 to $1,380 per ounce in the first quarter of 2014.
There were other notable rallies along the way, but every one was snuffed out by disinflation, Fed tightening after 2013 or manipulation in the gold futures markets.
No gold investor can forget the “April Massacre” in 2013 when gold was crushed from $1,550 to $1,360 per ounce in two weeks, a 12% rout.
Buying the dips was a consistently losing strategy as gold continued its downward trajectory after every brief rally. The pain continued until December 2015.
Now here’s the good news. The bear market is officially over.
What’s the evidence for this claim?
The most important piece of evidence is the technical behavior of the prior bear market itself.
Over many decades, commodities rallies have exhibited 50% retracements (bear markets) before resuming their long-term upward trends based on the slow, steady devaluation of the fiat currency in which the commodities are priced.
Using the $252 price from August 1999 as a baseline and referencing the September 2011 peak price of $1,900 per ounce, gold gained $1,648 per ounce in the bull market. A 50% retracement of that 12-year rally means a decline of $824 per ounce (i.e., 50% of the $1,648-per-ounce gain), which would put gold at $1,076 per ounce.
Guess where gold bottomed? It bottomed at $1,051 per ounce, within 2% of the 50% retracement target. That decline is an almost perfect technical retracement.
By itself, this pattern proves nothing without additional confirmatory evidence. This is why we did not call the end of the bear market in 2015. We needed more proof.
There were (and still are) plenty of analysts calling for $800-per-ounce gold. How do we know that recent gains are not just another bear trap?
The reason rests in the consistency of the gains. Gold rose 8.5% in 2016, a solid if not spectacular gain. Then gold rose again in 2017, also by about 8.5% (with another five business days of trading left in the year).
Gold fell on an annual basis in 2013, 2014 and 2015. Gold has not had back-to-back annual gains since 2011–12. These back-to-back gains in 2016–17 point to a solid foundation and a decisive break in the prior years’ bear market trend.
This “steady Eddie” performance the past two years has been overshadowed by much more spectacular gains in stocks and bitcoin.
Recent gains in stocks may continue for a while but are ultimately unsustainable because of the likelihood of a recession or liquidity crisis in the next few years. In those conditions, a retreat in stock prices of 30–50% would not be at all unusual.
Bitcoin is an unprecedented mélange of fraud, mania and a Ponzi scheme all in one. The bitcoin price could go higher in the short run but will also end in tears, with 90% losses for naïve “investors” from around the world lured into an artificially pumped-up mania.
Meanwhile, gold is in the early stages of a sustainable long-term bull market that will come to surpass the 1999–2011 bull market in time.
Investor psychology has been slow to change despite recent gains. Gold investors have been discouraged by the periodic drawdowns in the gold price, including the November–December 2016 mini-crash after Trump’s election.
But these short-term drawdowns need to be considered in the context of the much more positive long-term trend just described.
The historic 1999–2011 rally also started slowly and then gained steam. The largest percentage gains year over year did not begin until 2005, almost six years after the bull market began. From there the bull market still had almost six years to run.
Jim Rickards
Your editor at the controls of a drilling rig on a gold mine in the Val-d’Or gold mining region of Québec. The rigs are used to drill for core samples, which are then evaluated for gold content. Based on the quality of the ore, the mine operator makes a decision either to dig up the gold or focus on another location. Numerous ore samples are taken before decisions on mining are made.
In addition to the retracement pattern and back-to-back annual gains that validate the start of a new bull market in gold, another technical pattern (with fundamental roots) has emerged as a positive for gold.
I’m sure you’ve heard the old adage that things happen in threes. This can apply to good things and bad. Right now we’re witnessing a positive phenomenon in threes when it comes to gold and Fed monetary policy.
On Dec. 16, 2015, the Fed raised interest rates for the first time in nine years. This was the famous “liftoff” and happened after the Fed teased markets about a rate hike through all of 2015.
Immediately after the rate hike, gold surged from $1,062 per ounce to $1,366 per ounce by July 8, 2016, a spectacular 29% rally and gold’s best six-month performance in decades.
Then on Dec. 14, 2016, the Fed again raised rates for the first time since the December 2015 rate hike despite earlier expectations that the Fed would hike rates four times in 2016. Gold surged again from $1,128 per ounce at the time of the rate hike to $1,346 per ounce on Sept. 8, 2017, a 19% rally in just over nine months.
Last week, for the third December in a row, the Fed hiked rates again after taking a “pause” on rate hikes in September. Once again, gold answered the starting gun. Gold immediately rallied from $1,240 per ounce on the afternoon of Dec. 13 to $1,258 per ounce the next day, a solid 1.5% gain in one day.
If gold follows the pattern of the last two December rate hikes, this new rally could go to $1,475 or higher by next summer. That would be a 20% rally in six months, roughly comparable to the rallies after the December 2015 and December 2016 rate hikes.
Price of Gold
This chart shows the U.S. dollar price of gold from March 2015 to December 2017. The Federal Reserve (“Fed”) raised interest rates in December 2015, December 2016, and December 2017. After the first two rate hikes, gold staged spectacular rallies of 29% and 19% respectively in a matter of months. Gold is up 2% in the few days since the last Fed rate hike. A powerful new “Fed rally” has begun from a higher level than the past two. This should take gold to $1400 per ounce by mid-2018.
Of course, nothing moves in a straight line. There will be new drawdowns to go along with the new rallies. But the upward trend seems well-established at this point.
Some of this price action following the three December rate hikes could just be noise or coincidence. We all learned in statistics class that correlation does not mean causation. And three events may correspond to the adage, but it’s not exactly a longtime series on which to build a statistical case.
Still, it’s an intriguing pattern. Gold has a reputation for being the most forward-looking of all macro indicators. Gold investors smell trouble and opportunity long before stock and bond markets catch the scent.
The fact that gold would rally after a rate hike is counterintuitive. Usually higher nominal rates equal higher real rates, which is poison for gold.
Why the rallies?
The gold market is looking through the rate hike and asking what comes next.
After all, the December rates hikes in 2015, 2016 and 2017 were all advertised well in advance by the Fed and were fully discounted by the market. This means that the rate hike was a nonevent, because gold was already priced for it.
Yet the rate hike itself and the Fed’s commentary suggest both a head wind for economic growth and possible Fed ease in the form of future inaction and forward guidance relative to expectations. That’s exactly what happened after the 2015 and 2016 rate hikes. If the Fed takes its time on future rate hikes because of weak growth and disinflation, the dollar will weaken and gold will get a huge lift.
If the pattern of the last two years repeats this year, gold will reach a much higher level because it’s starting from a much higher level. The December 2015 rally started from $1,062 per ounce. The December 2016 rally started from $1,128 per ounce. This rally starts from $1,240 per ounce.
This pattern of “higher highs and higher lows” has persisted through the past three years despite rallies and drawdowns along the way.
If good things come in threes, then this is the third December rally in a row and could take gold back to the long-awaited $1,400-per-ounce level. Now looks like a good time to jump on board to enjoy the ride.
As readers know, Currency Wars Alert considers gold a form of money. We analyze gold side by side with dollars, yen, euros and other major currencies from a relative valuation perspective.
What other evidence exists for the conclusion that we’re in a sustainable long-term bull market for gold and not just another false start?
At Currency Wars Alert, we use the proprietary IMPACT method to assess the influence of geopolitics and central bank policy on currency and capital markets performance.
IMPACT is a method my colleagues and I created while conducting threat analysis at the CIA. We used information from capital markets as a predictive analytic tool to uncover both terrorist attacks and geopolitical threats in advance.
IMPACT combines the disciplines of complexity theory, applied mathematics and dynamic systems analysis to spot hidden trends in markets that affect both exchange rates and asset valuations in foreign markets. These trends typically reveal different paths that markets might take.
After identifying alternate paths, we develop a list of what the intelligence community calls “indications and warnings” (I&W) associated with each path. We scan and filter news and data feeds continually to identify the relevant I&W. Once we see a persistent pattern, we can be reasonably sure we’re on a particular path and not another.
The most important fundamental factor in favor of higher gold prices right now is the imbalance between physical supply and demand. I have seen both sides of this equation firsthand.
On the supply side, I have visited gold mines in South Africa, Canada, Australia and the U.S. I have been to gold refineries in Switzerland and gold vaults in Sydney, Switzerland and New Castle, Delaware. I speak with gold dealers on an almost daily basis.
On the demand side, I have met with government officials in Russia and China and with the senior officers responsible for gold trading at the biggest banks in China.
In every visit and every conversation, I encountered the same complaint: Physical gold is in short supply.
Refiners can’t get enough to meet demand. Miners are looking at five-year lead times on new discoveries and reopening old mines shut in during the price collapse of 2013–15.
Vault operators are seeing the shift from bank storage to private storage, which reduces the floating supply needed to support the paper gold manipulations.
In addition, we are looking at several major gold spike catalysts in 2018, including a trade war with China and a shooting war with North Korea.
Russia, China, Iran and Turkey, what I call the “Axis of Gold,” continue to buy gold overtly and covertly in prodigious quantities.
The western gold powers such as France, Italy, Switzerland, Germany and the IMF have not sold an ounce of gold since 2010.
The U.S. has barely sold an ounce of gold since 1980.
On a worldwide basis, demand is up and supply is down, and that can only mean one thing in the long run — higher prices.
This combination of fundamental, technical and geopolitical factors is converging in 2018 in a way we have not seen since the late 1970s. The new bull market in gold will be even more powerful than the 1971–1980 bull market and the 1999–2011 bull market.

Monday, January 01, 2018

An Investor's Diary

Typically, a bull market in equities begins with the smart money discovering the value in the market. The market leaders lead the rally. Broader market usually underperform the benchmark in early phase as the wounds inflicted by the preceding bear market are still fresh, the safety of principal and fear of further fall in market is still the dominant sentiment.
Subsequently, the followers join the rally. Having missed the rally in market leaders, the herd usually tries to discover value in broader markets. As the confidence in recovery grows, the fear now paves the way for rationality and return optimization. The broader market begin to marginally outperform the benchmark indices in this phase.
In the last phase, the masses join bandwagon. Discovering multi baggers and return maximization becomes a passion. Greed is conspicuously the dominant sentiment. The divergence between the benchmark and broader markets is stark. The jargon changes. New valuation methodology are devised to justify the irrationality in valuations. Proliferation of companies with unproven business models is quite normal in this phase.
The reversal post this phase is often sharp, deep and painful. The broader markets crash vertically. The benchmark indices correct sharply. Invariably, the greed is found lying on the street, totally shattered.
The story has been the same in all the price cycles, the markets have witnessed so far, without exception.
In my view, we are presently in the last leg of the last phase of the current market up cycle that began in summer of 2013.
Those who witnessed the last major market cycle (2005-2009), would recall the period between July 2007 and January 2008. Subprime crisis in USA had already raised its head in July. The markets took a notice and corrected around 10%.
But the money was so easily available and greed was so overpowering that our markets rallied almost 50% in the following 6months, only to collapse in the following year 13months.
All the arguments that are usually being extended to support the current equity prices, were present then in even stronger force.
The difference was that the world was willing to work together to ward off the ill effect of any global crisis, central bank balance sheets had lot of scope to expand, China and India were growing over 9% and many other large emerging economies and frontier economies were looking to grow even faster. Commodities' world was booming as China was guzzling whatever the world produced. The world was growing at 4%+ rate.
Today, the world stands fragmented. UK leadership is busy managing Brexit, US leadership is totally committed to parochial interests, so is China, India and Russia. Peripheral Europe and LatAm remains as vulnerable as it was 6yrs back.

Nifty 1.png


As stated earlier, in pure technical terms, I see Indian markets in the last leg of the bull phase that started from summer of 2013. The correction from here will be sharp and deep.
While it is difficult to forecast how much more it can go up, before the correction sets in, it is easier to forecast the contours of the down cycle, that is as follows:.
Strictly in technical terms, Nifty has definitely completed the up move that started from 28 August 2013 from low of 5285 (intraday low 5118) a few months ago. Any move beyond 10114 is a bear market rally, in my considered view.
Base case for 2018
Nifty should bottom around 8470 in next 13months, i.e., a 50% correction of the rally from 6825, the low of March 2016.
Probable scenario for 2018
Nifty may correct 38 to 50% of the up move (5285 to 10114) in next 13months. Which means, the downmove may bottom between 8280-7700 Nifty level by January 2019.
Worst case scenario
The worst case scenario could be that Nifty corrects the entire gains made since March 2016 low of 6825.
To sum up, in strict technical sense—
(a)   Indian equities are no longer in a bull market.
(b)   From the current level, Nifty may correct 20-35% over next 13months.
(c)    Every rise from the current level is an opportunity to sell.
Nifty-2.png

( This is a forwarded article and not our view. Please do your research before deciding upon anything)