Wednesday, June 22, 2016
Tuesday, June 21, 2016
The Fed’s tributaries
Which emerging markets are most in thrall to America’s central bank?

OUTSIDE the Federal Reserve’s imposing building in Washington, DC, water cascades from two fountains shaped like chalices. Inside, the Fed’s decision-making generates equally prodigious spillovers, channelling the flow of capital around the world. The consequences, especially for emerging economies, can be monumental but they are rarely elegant.
Until last week many emerging economies had been bracing themselves for an imminent rise in the Fed’s benchmark interest rate, perhaps as early as this month. Higher rates could draw more money into America from emerging markets, weakening their currencies and raising their bond yields. Even the expectation of tighter money can be enough to cause trouble. In such circumstances, central banks far from the Fed often feel compelled to raise rates too, even if economic conditions at home do not entirely warrant it. In 2014 Arvind Subramanian, now the chief economic adviser to India’s government, complained of “dollar imperialism”.
On June 3rd, however, the emperor granted a reprieve. Surprisingly bad jobs figures released that day ended all talk of a Fed rate hike this month (see article). American bond yields duly fell and the dollar weakened; emerging markets rallied. The numbers provided a useful test of the Fed’s sway. Normally, this is hard to measure, since expectations of a rate rise cannot be observed directly and tend to evolve only gradually. The shift on June 3rd, however, was unusually stark.
Which emerging markets benefited the most? The Turkish lira and Brazilian real ended June 3rd over 1.5% stronger than the day before; the Russian rouble gained over 2%; and the South African rand climbed by over 3%. The impact was surprisingly weak, by contrast, on Mexico’s peso and India’s rupee. Nor was there much effect on China’s currency, which does not float freely, although China may yet benefit from a slower flow of capital out of the country.
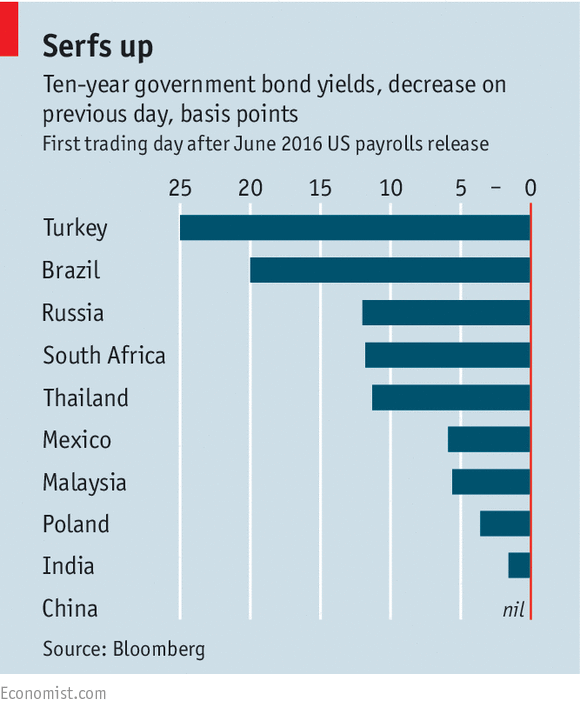
The ranking of emerging-market thraldom was broadly similar for government-bond yields (see chart). Yields fell by about 0.2 percentage points on June 3rd in Brazil and Turkey. They narrowed by about half that in Russia and South Africa, as well as in Thailand when its markets opened on June 6th. China again remained in splendid isolation. And India was strangely unmoved. Its central-bank chief, Raghuram Rajan, is among the most prominent critics of the Fed’s unilateral monetary power, along with his compatriot, Mr Subramanian. Yet India, on the basis of this small experiment, seems newly immune to it.
Nifty
Nifty Has given a buying signal
Can be bought and added at 8220-8190
Stoploss 8110
The major run-up will start only on a close above 8300
Monday, June 20, 2016
Rajan shielded Indian banks from a Lehman-like crisis. And how!
Ever since Raghuram Rajan took charge as the 23rd governor of the Reserve Bank of India in August 2013, the central bank, in tandem with the government, has introduced a series of reforms and measures in the banking system to support growth and bring down non-performing asset.
But has RBI really done enough to pre-empt a possible collapse of the Indian banking system, far less to avoid a Lehman-like crisis in India?
The collapse of the global investment bank, Lehman Brothers, in September 2008 had brought the financial sector the world over to its knees. With $639 billion in assets and $619 billion in debt, Lehman's bankruptcy filing was the largest in history.
Even though the economic recovery is not happening at the desired pace, RBI and the bank boards have made it reasonably clear that they would not let a Lehman moment occur in India," Saurabh Mukherjea, CEO Institutional Equities, Ambit Capital, said in an interview with ET Now.
Raghuram Rajan specifically said two weeks back on the sidelines of the money policy meet that he would make sure that India does not have its own Lehman Brothers moment.
"The banking system is not going to the dog house and that is why I took the crisis call off the table. So, assuming a modest scenario of around 10 per cent earnings growth this financial year, it will lead Sensex to around 29,000-29,500 in FY17," he added.
So what steps have RBI and the government really taken to support the banking system and reduce stress on assets in the banking system?
Asset quality review: The asset quality review (AQR), which was started by the Reserve Bank of India (RBI) back in February this year, was to ensure banks were taking proactive steps to clean up their balance sheets, which will help them in the long run.
Under the scheme, banks have been advised to clean up their balance sheets and declare certain accounts as non-performing assets (NPAs), which are at present not marked as such.
Following the asset quality review, banks have reported a near 70 per cent surge in non-performing assets over the past six months.
Gross NPAs of banks and institutions have shot up by Rs 2,41,000 crore in December and March quarters, mostly due to aggressive provisioning undertaken by the PSU banks at the behest of RBI.
Indradhanush: A ray of hope for PSU banks
The acceleration in recognition and provisioning for non-performing assets (NPAs) is only an initial step in the revamp of Indian banking.
The Centre is looking to inject some life into the public sector banks (PSBs) with the launch of a seven-pronged plan - Indradhanush - on August 2015 to infuse Rs 70000 crore.
The Indradhanush plan is already in works with an allocation of Rs 250 billion in the Union budget for 2016-17 for capital infusion into PSBs. While this allocation is largely being seen as insufficient, the government emphasised that it would not be considered the last word with respect to recapitalisation of PSBs and that the government is committed to providing more capital.
PSBs should raise the remaining Rs 1,10,000 crore from the market. Moreover, the government is committed to making extra-budgetary provisions in FY18 and FY19 to ensure that the PSBs remain adequately capitalised to support economic growth.
Bankruptcy code - A step in right direction
The government gave a nod to the new bankruptcy code in May 2016. The bankruptcy bill will make it easier to exit or attempt a revival of business and will help speedy winding up of insolvent companies.
"The new law will provide for dealing with bankruptcies, replacing multiple laws dealing with the issue, including the Companies Act, 2013. This will also help drastically in containing the non performing loans in the financial sector," The Institute of Company Secretaries of India said in a report.
The law will ensure time-bound settlement of insolvency, enable faster turnaround of businesses and create a data base of serial defaulters-all critical in resolving India's bad debt problem, which has crippled bank lending.
"Apart from this, foreign lenders will also be more comfortable in extending loans, which are a plus for the country. The new law is expected to improve India's ranking in the World Bank's index of ease of doing business," the report said.
Sustainable structuring of stressed assets: The Reserve Bank of India's scheme for sustainable structuring of stressed assets (S4A) is yet another tool provided to the banks to tackle the growing challenge of stressed assets emanating from loans given to large companies turning bad.
Experts say this is an improvisation of the two other tools announced by the regulator in the past 18 months to address asset quality challenges at banks: structuring of project loans under the 5:25 scheme, and strategic debt restructuring (SDR).
CrisilBSE -0.79 % estimates that weak assets in the Indian banking system will touch a high of Rs 8 lakh crore by the end of this financial year.
S4A could help banks limit fresh slippages to non-performing assets (NPAs) from large corporate exposures. "S4A envisages the determination of a sustainable debt level for stressed borrowers, and bifurcation of outstanding debt into sustainable debt and equity/quasi-equity instruments, which are expected to provide upside to lenders when the borrower turns around," said the Crisil report.
MCLR - Enabling faster policy transmission: The Reserve bank of India (RBI) slashed rates by 150 basis points (bps) since the start of last year, but the country's banks have cut lending rates by less than half that. The repo rate stands at a five-year low of 6.50 per cent. Enabling faster transmission would help credit growth in last 4-8 quarters.
The banks have reduced their lending rates between 0.6% to 0.8% only. The changes in repo rates did not directly affect their lending rates, leading to a mismatch in the transmission of these reductions to banks' customers.
In order to deal with the mismatch and bring parity between lending rates, the RBI mandated banks to adopt the marginal cost of funds based lending rate (MCLR) method .
The MCLR considers the marginal cost of funds, which is based on the cost of funds due to the interest payable on its deposits as well as the repo rate, cost of maintaining CRR, operating costs & a tenor premium. The final rate for a borrower will be calculated after adding the credit risk premium to the MCLR.
Nifty..
Nifty Range Remains 8320-8075
Close above and below these figures will clarify the trend.
Till then one should remain conservative.
Close above and below these figures will clarify the trend.
Till then one should remain conservative.
Friday, June 17, 2016
Current Trends & the Future of the Hedge Fund Industry.
What Current Trends Tell Us about the Future of the Hedge Fund Industry
The following comments are excerpted from Agecroft Partners’ Don Steinbrugge’s presentation delivered at the 69th CFA Institute Annual Conference held in May, 2016 in Montreal. In Mr. Steinbrugge’s session titled “What Current Trends Tell Us about the Future of the Hedge Fund Industry” he discussed a number of the recent quotes and articles directed to the hedge fund industry that were covered broadly by the media.
Third Point Capital CEO Dan Loeb thinks hedge funds are in the first stage of a “washout” after “catastrophic” performance this year.
The HFRI Fund Weighted Composite Index posted a decline of -0.67 % in Q1 of this year, which on the surface isn’t that bad. Upon closer examination, this moderate decline is hiding the vastly different paths various managers and strategies traveled during the quarter.
In January and February, strategies with a lot of beta, exposure to the equity and fixed income markets, such as activists, long/short equity, and distressed debt, generated very poor performance which was significantly worse than most investors’ expectations. Investors do not mind if these strategies underperform during a bull market, but they are expected to reduce downside volatility during periods when the market sells off. Fortunately, these strategies rebounded significantly during the month of March and only finished the quarter slightly down. Nonetheless, investors remain disappointed that these strategies did not provide the downside protection they expected.
Strategies that are uncorrelated to the capital markets performed very differently. For example, many direct lending, and reinsurance managers posted positive returns in each of the first three months. Market neutral and relative value fixed income managers generally exhibited significantly less volatility than high beta oriented strategies. CTAs, although volatile, enhanced a diversified portfolio’s Sharpe Ratio by being negatively correlated during the quarter; they were up in January and February and then gave back some of the gains in March when other strategies rallied.
What is also not apparent when looking at the quarters’ performance is the huge dispersion of returns exhibited by managers within each strategy. In many cases there was over a 20% differential in returns between the best and worst performers within a single strategy. When strategies underperform investors’ expectations and when dispersion of returns between managers increases significantly, it results in a significant increase in fund redemptions, especially for those managers that underperformed.
It is our belief that most of this money will stay within the hedge fund industry. Some will be reinvested within the same strategy with managers that have significantly outperformed their peers. Other assets will shift away from high beta oriented strategies that exhibited significant volatility in the first quarter, and be re-invest in uncorrelated strategies that protected investors’ capital during the selloff in January and February.
This increase in demand for strategies uncorrelated with the capital markets is also driven by two other factors. The first is investors’ concern that the capital markets have significant tail risk. The sluggish growth of the world economy raises fears of another 2008 type selloff which could be compounded by monetary authorities around the world lacking the dry powder necessary to stimulate the global economy.
In addition, hedge fund investment decisions stem from allocators’ forward looking view of each strategy’s expected return and associated risk (volatility). Back in 2009, it was very difficult to raise assets for a market neutral equity strategy or a relative value strategy which were expected to generate mid to high single digit returns because most investors were looking for strategies that could generate mid teen returns. As interest rates came down, spreads tightened and equity valuations increased, investors’ return expectation for beta oriented strategies declined. Three years ago, investors were generally looking for a 10% minimum return to warrant an allocation. Over the past three years expected returns have continued to decline. Today most investors are looking for a mid to high single digit return for their hedge fund portfolio. In this environment, uncorrelated strategies look very competitive from a risk return standpoint.
As investors pull their money out of poorly performing funds, we will see an increase of fund closures. Some of these firms’ assets will decline to the point where they are no longer profitable. Others will acknowledge that the significant drawdown they suffered in the first quarter will materially impair their ability to raise capital for the next several years.
Hedge funds lose most money since 2nd quarter of 2009.
It is true that the hedge fund industry saw the most outflows in the first quarter of 2016 since the second quarter of 2009. To put this in perspective, the hedge fund industry has grown fivefold in the past 15 years from approximately $600 billion in 2000 to $3 trillion at the end of 2015. The $15 billion of outflows the industry experienced in the first quarter of this year represents only one half of 1 percent of the industry assets. Even eight quarters in a row of $15 billion in redemptions, would barely make a dent in industry’s AUM.
Former hedge fund manager and multi-billion dollar family office CEO Steve Cohen recently spoke at the Milken Institute Global Conference and stated, “It’s hard to maximize returns and also maximize assets.”
Many hedge fund investors agree that there is an inverse correlation between asset size and performance. This can be viewed on an industry basis and at the manager level. At the industry level, the 5x increase in hedge fund industry AUM since 2000 has made it more difficult for managers to generate strong returns. While this does not mean that hedge fund managers cannot make money, it does mean that return expectations have generally come down and more so in some strategies than others.
At the manager level, before 2008 it was very common for successful hedge fund managers to close their doors to new investors to keep assets under management at a level where they could maximize returns. Today, more and more managers are growing their assets well above their optimal asset level and effectively prioritizing asset gathering over performance.
Some institutional investors’ hedge fund strategy is to build out diversified portfolios comprising the largest most well know managers. While some large managers continue to generate very strong returns, a portfolio diversified across only the largest managers will probably generate sub optimal returns.
Cohen also noted that talent within the industry is thin.
The number of hedge funds has significantly increased in the past few years to an estimated 15,000 funds. We believe that only 10-15% are of the quality to justify their fees. These percentages are also consistent with our views on the mutual fund industry where most managers under perform their benchmark. The high percent of lesser quality managers considerably dilutes the performance of the hedge fund industry as a whole which is reflected in the returns of the hedge fund indices. Even with the recent poor performance, I believe that money stays invested in hedge funds, in large part, because most professional hedge fund investors believe they can do significantly better than the indices. The key to successfully investing in hedge funds is to select the strategies and the top talented managers that will enhance the risk adjusted return of a portfolio. Seeing an increase in the closure rate of low quality hedge fund organizations would be a positive for the industry.
Buffett stated that hedge funds get unbelievable fees for bad results.
Not surprisingly, the hedge fund industry views these comments as prejudicial and unfair. While his comments may be true for a majority of funds, there are a number of managers that are extremely talented and well worth the fees they charge. In addition, there are a number of strategies that add significant diversification benefits to portfolios that cannot be replicated by ETFs or index funds.
Christopher Ailman, CIO of CalSTERS, stated the “2 and 20 model is dead.”
Actually, the standard fee, included in hedge funds’ operating documents, has come down very little over the past few years. We have, however, seen a significant increase in hedge funds negotiating lower fees for large, institutional mandates. Pension funds, like CalSTERS, that can allocate more than one hundred million dollars to a manager should almost never have to pay 2 and 20 unless it is for a truly exceptional manager or for a capacity constrained strategy. Large pension funds that allocate to small and midsized managers should be able to negotiate fee arrangements that are 25-50% below the standard rate.
“NYCERS votes to exit hedge funds. Will other pension funds follow?”
Approximately 18 months ago CalPERS also voted to exit all hedge funds. Although widely covered by the media and discussed across the industry, almost no other pension fund followed CalPERS’ lead until NYCERS’ decision. We do not believe many pension funds will eliminate hedge funds from consideration in their portfolio for two primary reasons. First, most pension funds take an academic approach to their asset allocation which includes formulating forward looking assumptions for returns, volatility, and correlations for each component of their portfolio. These assumptions are based on a number of factors including long term historical returns for an asset class, current valuation levels, and economic expectations. Most institutions are currently using a return assumption for core fixed income of between 2.5% and 3%. Up until last year, these investors’ return assumption for a diversified hedge fund portfolio was between 4% and 7%. Even if those return assumptions decline, they should still be higher than those forecasted for fixed income. As long as the expected returns from a diversified hedge fund portfolio, after fees, is higher than those of a traditional fixed income portfolio, most pension funds will continue to invest in hedge funds.
Second, pension funds will not eliminate all hedge funds from their portfolios because hedge funds are not an asset class, but a fund structure comprising many different strategies. Some of these can add valuable diversification to a portfolio. Many pension funds learned, during the market selloff in the fourth quarter of 2008 that they were not as diversified as they thought. Correlations between strategies and individual investments rose closer to +1.0. There is still a valuable place for investments which can improve the risk/reward profile of pension portfolios.
In conclusion, aside from the effects of changes in market value, we expect the hedge fund industry’s total assets at the close of 2016 to be fairly close to where they started the second quarter of the year.
Thursday, June 16, 2016
Guns in America: A history of violence
Evidence is growing that gun violence in America is a product of weak gun laws.
WITH awful, numbing regularity Americans use high-powered, high-capacity firearms to carry out mass shootings. And with awful regularity, efforts to reform America’s gun laws in the wake of such tragedies fail. (Indeed, a recent paper published by the Harvard Business School found that a mass shooting leads to a 75% rise in measures easing gun control in states with Republican-controlled legislatures.) More than 30,000 people die in shootings in America each year; no other rich country suffers anywhere near that level of gun violence.
Opponents of gun control argue that such figures have things backwards. In their view, widespread gun ownership deters crime, and thus benefits society. Advocates of tighter restrictions on gun ownership disagree: they believe the spur to gun crime from the ready availability of weapons far outweighs the deterrent effects. Social scientists have long struggled to adjudicate, since, on the surface at least, the data are ambiguous.
Pro-gun groups point out that rates of gun ownership tend to be highest in rural, sparsely populated states, where crime rates are low. By the same token, over the past two decades, as the number of guns in America has risen sharply, crime rates have fallen. Yet even as the number of guns in America has grown, the share of households with a gun has dropped steadily. Research published in 2000 by Mark Duggan of the University of Chicago concluded that the homicide rate had been falling in tandem with the proportion of households where guns were kept. What’s more, the homicide rate was falling with a lag, suggesting that reduced gun ownership was causing the decline, and was not simply a side effect of a falling crime rate.
Other studies have reached similar conclusions. An analysis published in 2014, for example, using detailed county-level data assembled by the National Research Council, a government-funded body, suggested that laws that allow people to carry weapons are associated with a substantial rise in the incidence of assaults with a firearm. It also found evidence that such laws might lead to increases in other crimes, like rape and robbery. A recent survey of 130 studies concluded that strict gun-control laws do indeed reduce deaths caused by firearms.
Links between gun ownership and violence are less well established than they might be, in part because lobbyists for gun rights have pushed to reduce public funding for research on the issue. In 2013 the Journal of the American Medical Association published an article on this phenomenon, describing how in 1996, for instance, Congress ordered the Centres for Disease Control to spend less money contemplating how to reduce shootings.
The main difficulty for academics studying the link between guns and gun crime, however, is the lack of a true counterfactual. A researcher cannot hold all other things constant while varying the stringency of gun laws in order to isolate the effect of those laws on the incidence of violence. That leaves open the possibility that any reductions in crime following a tightening of gun laws may be rooted in other, unrelated causes. Crime rates have tumbled in many rich countries in recent decades, complicating any analysis of the role of guns.
Nonetheless, some events can come close to offering an informative counterfactual. The aftermath of a mass shooting in Australia provides one example. In 1996 a gunman killed 32 people with a semi-automatic weapon much like the one used in the Orlando shooting on June 12th. Australia’s lawmakers quickly passed strict and sweeping gun-control rules. Semi-automatic rifles and pump-action shotguns were banned, and the government offered to buy weapons already in circulation from their owners (a programme of comparable scale in America would reclaim an estimated 90m guns).
Australia has suffered only two shooting sprees since then, claiming a total of seven lives. A decline in the rate of killings with guns, which was already under way before these rules came in, accelerated rapidly. Total gun deaths including suicides also fell. Before the change in the law the rate of deaths from firearms in Australia was about a quarter of that in America; afterwards, it fell to about a tenth of the American rate. In 2014 America suffered about 10.5 fatal shootings per 100,000 people; Australia recorded just 1.
The safety catch
It is not just the relationship between gun ownership and gun violence that is becoming clearer. Evidence is also building that even relatively modest gun-control measures reduce gun deaths. An analysis published in 2015 in the Annual Review of Public Healthnoted that state laws banning possession of a gun by individuals under a restraining order for domestic violence reduce the incidence of “intimate partner homicide” by 10%. The same analysis reports that firearm homicide rates rose by 25% in the five years after Missouri repealed its law requiring permits to purchase a gun, even as the national rate nationwide fell.
Public-opinion surveys show widespread support for tighter controls on gun ownership in America. Indeed, nearly half of Republicans, the party most sympathetic to gun ownership, favour a ban on “assault-style” weapons. Their will is frustrated, however, by a political system that enables passionate minorities to stymie legislation.
In 2013, in the wake of the Sandy Hook massacre, in which 20 schoolchildren were shot dead, two senators, one Democrat and one Republican, introduced a measure that would have required background checks on most gun sales. It failed to move forward despite a majority vote in its favour, because supporters were unable to assemble the supermajority needed to overcome a procedural hurdle. Seemingly intractable disputes in American politics do sometimes give way to overdue reform. More probably, America will make scant progress in dealing with its gun problem until it begins to resolve its broader political problem.
Nifty..
2 figures for nifty 8300-8075
Close above 8300 nifty gets ready for a bull run
Below 8075 deep correction till 7700 can be seen
Wednesday, June 15, 2016
Brexit: Everything You Need To Know..
In just a few days, it’s conceivable that the European Union’s political and economic future could be reshaped by the UK’s June 23-scheduled referendum vote regarding whether Britain should retain membership in, or exit, the EU. Popularly known as ‘Brexit’ – shorthand for Britain Exit—the vote outcome could have far-reaching consequences for not just the British and Eurozone economies, but also for global currency and equity markets in particular.
Over the course of three articles, published within the next week, we’ll take a deeper look at what the vote means for all involved. Today’s article will examine the reasons for the referendum; Part II, which we’ll publish later this week, will consider the consequences either a remain or leave outcome might have on major currencies; and Part III, which we’ll publish early next week, will detail the affect the vote will likely have on global and UK stocks.
What Exactly Is the European Union?
The European Union (EU) is an economic and political union of 28 free states, located primarily on mainland Europe. Each member state acknowledges, upon joining the EU, that they have entered the international treaties covered by the Union of their own free will, without being forced to do so by a third party or superpower. The Union’s strength – and ironically its fragility – comes from that very fact.
Under Article 50 of the EU treaty, "Any Member State may decide to withdraw from the Union in accordance with its own constitutional requirements". To date, none of the EU’s member states has ever elected to leave the Union, while the waiting list to join the EU is lengthy. A decision by the British people to become the first country to leave the EU could have ramifications not only for the UK's future, but also seriously tarnish the EU's prestige and political power.
Prior to the European Union’s founding on November 1, 1993, Britain was part of the much smaller European Economic Community which it joined in 1975. The EEC—often referred to as the Common Market—had 9 member states and was primarily a trading arrangement.
Similar to the EEC, the European Union represents a single market for its member states. But unlike the earlier accord it has evolved into a much broader—and more political—entity that’s headquartered in Brussels, Belgium and along with trade-related issues, legislates over immigration and visa issues as well.
For many in the UK, that’s at the heart of the current problem.
Why does part of the UK want to leave?
Reasons vary. Politically, some citizens are concerned about the ever-growing power of the EU over its member countries. The EU has exclusive legislation power over areas such as common commercial procedures, transport policies, even rules of competition. This essentially means member states no longer have the right to introduce their own legislation in these areas, which many see as weakening individual sovereignty.
Economically, some believe that the free movement of people and goods—a core principal of the EU—is hurting Britain's own economy, as its government is unable to control the influx of migrant workers into the country, and businesses are free to move elsewhere in the EU at will. The border control argument, which has been going on for a number of years now, has gained greater traction recently and is now also being used in a security context, since some believe that disengaging from the European Union's policy towards the Syrian refugee crisis would benefit UK security.
Additionally, the UK contributes billions to the EU budget but gets quite a bit less in return. How much less is the subject of fierce debate. According to fullfact.org, the UK pays an annual 13 billionpound sterling in fees (approximately $18.4B), while it gets back approximately 4.5 billion pounds (approx. $6.4B) in EU spending on the UK, leaving the balance at minus 8.5 billion sterling (approximately $12B) for the UK.
Why would others want to stay?
Of course, those who wish to remain in the EU have their own set of arguments.
Politically, they want to stay in the EU because they believe united, each member country is stronger than it would be on its own. The EU has always seen itself as a global superpower, a status that currently would be unattainable for any of its individual member countries.
Indeed, while the UK, Germany, and France have far-reaching political influence in many different parts of the world, each could not rival the US’s foreign policy clout on their own. This argument also serves stay supporters when discussing security issues, as they believe that strength in numbers is crucial for dealing with future threats.
Economically, EU member countries are able to export within the EU at no cost, boosting sales of British products to mainland Europe. The EU is also able to negotiate better trade deals, as access to the entire European market is an attractive proposition for external trading partners.
Stay supporters argue that the UK will never be able to negotiate better terms on its own. For example, the TTIP, Transatlantic Trade and Investment Partnership, which is currently under negotiation between the US and the EU could become the biggest trade agreement ever formed. Should the UK leave the EU, it would have to negotiate on its own, for better or for worse, depending on one’s perspective.
Finally, while immigrant workers are seen as detrimental to the British economy by supporters of the leave faction, those who wish to stay claim young immigrants help spur growth which will only strengthen the country's economy.
Macro vs Micro
Everything discussed so far concerns the macro economy. But is there a way to prepare your individual portfolio for a possible Brexit? Yes and no.
It’s impossible to foresee all of the different ways 'Brexit' could affect one’s personal investments. However, there are ways to guard against—as well as hedge against—the possibility of a UK exit.
In part II of this series, to be published later this week, we’ll take a look at how the pound sterling might be affected, as well as theUS dollar and some of the other FX majors.
Tuesday, June 14, 2016
Monday, June 13, 2016
Friday, June 10, 2016
The S&P 500 is the World’s Largest Momentum Strategy
In many ways the stock market makes no sense. You would assume that half of all stocks would outperform a market index while the other half would underperform. Then all you would have to do is pick from the top half and avoid the bottom half, make massive amounts of money and go buy an island somewhere.
Unfortunately, the stock market doesn’t follow a normal bell-shaped curve. Active investing may be a zero-sum game, but picking individual stocks is not. It doesn’t work out that half of all stocks outperform and half of all stocks underperform. There are huge tails when you look at the extreme over- and under-performers in the market.
This is exactly what Eric Crittenden at Longboard Funds did in a recent blog post. This visualization of the winners and losers in the stock market since 1989 is fascinating:
Here are the stats behind this excellent chart:
We analyzed 14,455 active stocks between 1989 and 2015, identifying the best performing stocks on both an annualized return and total return basis.
Looking at total returns of individual stocks, 1,120 stocks (7.7% of all active stocks) outperformed the S&P 500 Index by at least 500% during their lifetimes. Likewise, 976 stocks (6.8% of all active stocks) lagged the S&P 500 by at least 500%. The remaining 12,404 stocks performed above, at or below the same level as the S&P 500.
This data may come as a surprise to many. Over 40% of all stocks during this period ended up with a negative return. And the winners in the stock market are a much smaller group that account for the entire gain over this period:
These numbers are staggering — 20% of all stocks have accounted for the entire gain over this time frame, meaning the remaining 80% have collectively given investors no return. From 1989-2015 the S&P 500 was up almost 1200% in total. The majority of that gain came from a small number of stocks while the rest were more or less worthless.
There are a few different ways you could choose to look at this data:
- Try to avoid the losers and pick the winners.
- Own the whole thing and benefit from the huge impact that the winners give you.
- The S&P 500 is basically a momentum strategy.
Momentum investors cut their losers and let their winners run. In a roundabout way, that’s exactly what the stock market has done over time. Recently shared stats illustrates part of this equation:
Compared to 2004, more than a fourth of the companies then in the S&P 500 have “been acquired, taken private, or gone bankrupt,” though there have been hundreds of IPOs since.
The very nature of a market-cap weighted index means that the performance will be driven by something of a winners-take-all scenario. The cream rises to the top and the losers tend to fall by the wayside.
Now, is it possible to avoid the losers and only invest in the winners? Sure, anything is possible. Is it probable? Technically, based on this data it’s a low probability strategy. Obviously, many of the companies in that 80% group were smaller, more risky companies that you would expect to fail. Not every business is meant to succeed over time. And there are ways to screen for quality and valuation that can give you better odds of success at avoiding the worst of this group.
But one of the reasons the S&P 500 (or and other Index around the world) is so hard to beat is because it has a built-in mechanism to let the winners ride by the way it’s constructed. By our very nature we have a tendency to hold onto our losers and sell our winners too quickly. The S&P 500 or any systematic strategy doesn’t have these same issues holding them back. Can you imagine owning stocks like Apple, Amazon, Google or Facebook as they continued to rise over the years? How many of us would have had the ability to hang on as those gains compounded and the market caps kept rising?
Buying during a bear market is probably one of the most difficult things an investor can do, but staying invested as stocks rise may be a close second. There are constant temptations to “take money off the table” or “de-risk your holdings” after a nice run-up. It’s not easy to allow compounding to occur without getting in the way and screwing things up.
Indices are nothing special — they’re systematic, disciplined, rebalanced occasionally, transparent, low-turnover, low-cost, and low-maintenance. Probably the biggest benefit an index has over a human is the fact that it has a disciplined process by default. It’s hard to compete in the markets if you’re not disciplined.
Subscribe to:
Posts (Atom)