About Me

My photo
An Investor and counsellor in Financial Market

Friday, December 29, 2017

5 Big Questions for 2018

Below are five questions to help guide your thinking when making investment decisions in the new year.  
  1. Will stocks follow the historical presidential cycle?
Next month marks President Donald Trump’s first year in office and the beginning of his second. How have markets responded to his pro-growth policies, including pledges to lower taxes and slash regulations?
The answer: Overwhelmingly. As of my writing this, the S&P 500 Index is up 19 percent year-to-date, far outperforming the historical returns we’ve seen in the first year of a president’s four-year term.
In the second year, returns have traditionally been lower than the first. From 1928 to 2016, such years produced average market gains of just above 4 percent, making it the weakest year.
The reason for lower returns in the first two years, according to CLSA analysts this week, could be that “an administration looks to put as much bad news and painful actions into the first two years to form a good bias for getting reelected or paving the way for the predecessor of its own party.” Recall that President Bill Clinton didn’t hesitate to hike taxes after getting elected—he signed the Omnibus Budget Reconciliation Act just eight months into his first term.
But Trump has taken a different strategy. As CLSA puts it, “all the good news is being front loaded in the first half of this presidential cycle.” Right out of the gate, Trump placed major executive and legislative agenda items on the docket, from an Obamacare repeal to deregulation to sweeping tax cuts.
Not all of these efforts have borne fruit, of course. Even last week, his tax overhaul appeared to be imperiled after serious concerns were raised by moderate Republican senators such as Marco Rubio, Bob Corker and Jeff Flake.
I remain optimistic, though, and I see no reason at the moment to think that 2018 won’t be an encore of 2017. We’re nine years into the current equities bull market, the second-longest in U.S. history, but there could still be plenty of “gas in the tank,” according to a Bank of America Merrill Lynch report this week.
So with only a month remaining to Trump’s first term, it’s important to remember the words of Warren Buffett a day before the president was sworn in. Even though Buffett backed Hillary Clinton in the election, he said that “America works and I think it’ll work fine under Donald Trump.”
  1. Will S&P 500 Index companies continue to post record-level earnings per share (EPS) in 2018?
Earnings per share (EPS) growth is one of the most reliable and closely monitored indicators of market health. It’s one of the key metrics we use to find the most growth-driven and profitable companies.

As my good friend Alex Green said in an interview back in August, “if you look back through history, you’d be hard-pressed to find a single example of a company that increased its earnings, quarter over quarter, year after year, and not see its stock tag along.”
Except for a slight dip from 2014 to 2015, when EPS for the S&P 500 Index fell from $119.70 to $117.55, earnings have been rising steadily since 2009.
As of today, EPS for 2017 stands at $133.73, a new record and up nearly 13 percent from last year.
Next year we could see them climb even higher, if estimates prove to be accurate. In a report last week, FactSet analysts predict EPS by year-end in 2018 to reach $143.17, a 7 percent increase from 2017.
In other words, the American stock market is poised to continue its record-setting bull run in 2018.
  1. Can small and mid-size businesses get any more pumped than they are now?
The short answer here is: Yes, they can—but not by much before a new all-time record is reached.
For the past 44 years, the National Federation of Independent Business (NFIB) has taken a monthly survey to measure the optimism of small-business owners, and in November, the index climbed to a skyscraping 107.5. That’s the second-highest reading ever, after the index hit 108.0 way back in July 1983 on the hopes of additional Reagan tax cuts.
If we drill down into the various index components, we find that owners are most optimistic about the next three months, with 27 percent saying it will be a “good time to expand,” up from only 11 percent one year ago. They’re ready to unleash capital, buy new equipment and increase labor.
In their monthly commentary, NFIB economists William Dunkelberg and Holly Wade wrote: “There is still much uncertainty about health care and taxes, but it appears that [small-business] owners believe that whatever Congress finally comes up with will be an improvement and so they remain positive.”
That positivity is shared by small-cap stock investors, who’ve driven up the Russell 2000 Index more than 12 percent since the beginning of the year.
  1. What will drive gold prices higher?
As of Friday, gold was up more than 9 percent for the year. If it stays at its current price level, gold will log its best year since 2011, when it returned 10 percent.
The yellow metal has faced a number of significant headwinds in 2017, including surging equity markets around the world and rate hikes by the Federal Reserve. Under the circumstances, I would describe its performance as highly respectable.
Potential tailwinds in 2018 could help the yellow metal crack the $1,300 level and head higher.
That includes a weaker U.S. dollar. CLSA analysts this week noted that the dollar has traditionally risen in seven-year cycles. Between 1978 and 1985, it gained 68 percent; between 1995 and 2000, 41 percent. The current bull market so far has seen the dollar rise 35 percent, which has been a challenge for gold, commodities and U.S. exports.
That might be set to change in 2018, when we could see a completion of the seven-year cycle. As CLSA writes, “our tactics through 2018 would be to sell U.S. dollar strength in anticipation of break below 91-92 support.”
Other possible tailwinds include geopolitical risks, negative real interest rates across the globe, continually expanding global debt and overvalued equities.
On Monday, the North Atlantic Treaty Organization (NATO) raised concerns that Russia has developed a ground-launched cruise missile system that might violate a 1987 Cold War pact banning such weapons. It’s believed the missile system would be able to strike Europe on very short notice. Meanwhile, the U.S. State Department is working around the clock to dissuade North Korea from continuing its nuclear weapons program. As a store of value, gold has historically performed well in such uncertain times.
Meanwhile, two-year government bond yields in a number of European countries—the Netherlands, Germany, Austria, Belgium, France, Spain and more—are below zero. As I’ve explained many times before, negative real rates have traditionally been constructive for gold in that particular country’s currency.
Finally, there’s some concern that too much money is flowing into equities right now. According to Bloomberg, the total market cap for world equities is now just a “whisker” away from hitting $100 trillion—a monumental sum, to be sure. Should there be a correction, the investment case for gold and precious metals will become stronger than ever.
  1. Can anything stop bitcoin?
Bitcoin made some people a whole lot of money this year. One year ago today, the cryptocurrency was trading in the $770 to $780 range. On Friday, it briefly broke above $18,000. That’s a phenomenal return of 2,200 percent. The total market cap of all cryptocurrencies has already crossed above $500 billion and is well on its way to $1 trillion.
So is there anything that could stop its progress?
The most obvious answer might be regulations, but remember, bitcoin made these unexpected gains even as several countries clamped down on the digital currency. Venezuela, which will introduce its own government-sanctioned cryptocurrency, is scheduled to begin regulating bitcoin, but as the bolivar loses more and more of its value, residents have had to rely on bitcoin to survive.
It’s not surprising at all to see that bitcoin has undergone the greatest surge in peer-to-peer trading in countries that have imposed some of the most stringent regulations on cryptocurrencies. This is a currency, after all, that does not require any third-party involvement to trade. It’s able to bypass governments, central banks and borders with ease.
As I said last week, this is precisely why bitcoin is appealing to many investors. And according to Metcalfe’s law, more investors could mean higher ask prices.
Bitcoin might be very appealing right now, but it’s important to keep in mind that this has been a very volatile market. If I didn’t readily have the money to buy bitcoin, I wouldn’t go into debt and certainly wouldn’t mortgage my house to get my hands on it, as some people are reportedly doing.
By Frank Holmes

Thursday, December 28, 2017

Gold, fiat, banking, and Bitcoin: the day of reckoning cometh

The “ridiculously wastefulmalignantguzzling” of electricity usage by Bitcoin miners is “illegally siphoning powercausing countrywide blackoutsnot remotely sustainable, and is ruining the planet.”
“By July 2019, the Bitcoin network will require more electricity than the entire United States currently uses. By February 2020, it will use as much electricity as the entire world does today.”
– Business Insider
Run for your lives, Bitcoin will kill us all! But wait, before we all go running for the nearest fallout shelter, let’s just examine for a minute if there’s any truth behind these claims. Will Bitcoin really boil the oceans? Unsurprisingly, upon conducting a most basic investigation of the above headlines, the majority turn out to be nothing more than specious defamation, propagated by click-baiters (at best), fear-mongers (at large), and outright liars (at worst; yes ).
That being said, a few of these articles do cite some apparently legitimate statistics regarding the energy consumption of Bitcoin miners: e.g. “Bitcoin [is] about 5,033 times more energy intensive, per transaction, than VISA, at current usage levels,” “each Bitcoin transaction requires the same amount of energy used to power nine homes in the U.S. for one day,” and “Bitcoin mining now consuming more electricity than 159 countries including Ireland and most countries in Africa.”
While there are some fairly large assumptions made above, a few of the statistics seem to be backed by reliable data and calculations and must be taken seriously. This generation must fearlessly undertake an all-inclusive accounting of the environmental impact that our modern civilization has on the biosphere and take immediate action to reverse those adverse impacts.
In order to create a sustainable future for our planet, it’s absolutely vital that we stop paying attention to economic bottom lines only. Instead, we ought to hold all socioeconomic entities to positive triple bottom lines, those being economic, social and environmental. Furthermore, we ought to insist that all human institutions maintain a positive triple bottom line. One of the most important tools we can implement in this process is the Life Cycle Analysis (LCA).
LCAs require much deeper and far-reaching analysis than is currently required by existing systems of financial accounting, where the primary concern is the potential financial gain of shareholders above all else. In addition to such accounting systems’ narrow and naive focus on shareholders’ profits, a triple bottom line LCA includes global environmental, social, and economic impacts across the entire life-cycle of the subject of focus. For example, the environmental and socioeconomic portions of an LCA may include (but are not limited to) the following concerns:
  • energy, material, and living inputs and energy, material, and living outputs involved over the course of the product’s entire life-cycle
    • e.g. mining of raw materials, transportation, refining, manufacturing, point of sale, usable lifetime, recycling, disposal of waste products, etc.
  • physical, mental, and social impact on the well-being of all life forms impacted by the product over the course of its entire life-cycle
    • e.g. plants, animals, locals, producers, manufacturers, sellers, consumers, recyclers, disposers, any third parties, etc.
Going to the effort of carefully, honestly, transparently, and inclusively creating such LCAs is no trivial task; however, the importance of such thorough analysis increases in step with humanity’s increasing power to affect the Earth’s chemical, geological, biological, and social systems.
Unfortunately, I myself lack the resources to undertake such a comprehensive triple bottom line LCA for the Bitcoin mining and legacy financial industries. But after a fairly lengthy search, I did finally come across a rather detailed series of analysis written by Hass McCook and published on CoinDesk, in 2014. I highly recommend reading through this five part series if you are interested in a comprehensive comparison of Bitcoin mining to the existing gold production, fiat minting, and banking industries. Otherwise, here are Hass McCook’s compiled data tables for his triple bottom line comparisons of the industries:
Additionally, here is the tl;dr version of some other relevant information I came across during my own research:
Note: I’ve omitted gold production, because despite its usefulness as a benchmark, it is not in direct competition with Bitcoin unlike the fiat minting and banking systems.

Fiat Minting

  • coins are being phased out globally, because they cost more to mint than they’re worth
  • polymer bills (used in Canada, Australia, and UK) cost twice as much as cotton-paper bills, but last 2.5-4 times longer
  • global inflation rate is 3.9%, thus fiat savings are worth less than half their original value after only 20 years
  • fiat currencies are plagued by counterfeiting, laundering, fraud, corruption, criminal activity, and the human suffering and death associated with such

Banking

  • the world’s ~2,394,700 ATMs, alone, used 18.9PJ of energy and produced 3.2 million tonnes of CO2in 2014
  • the banking industry is thieving, criminal and corrupt to its core, by design
  • the banking industry plays an integral role in global corruption, money laundering, organized crime, terrorism, and human devastation
  • seven million people are employed by banks and financial institutions internationally
    • these jobs would largely disappear if Bitcoin took over (would anyone cry over a few million bankers being out of work?)

Bitcoin Mining

  • Bitcoin is providing cheap, and simple access to banking and the global marketplace for billions of the world’s poorest people, a practical impossibility under legacy financial systems
  • Bitcoin mines require very few employees (<50 employees at even the largest mines)
  • employee commutes are virtually non-existent
  • over the yearsBitcoin mining rigs have dramatically improved their Power Usage Effectiveness (PUE) to well below data center industry standards
  • the useful life of most mining equipment is only about three to six months
    • however, 98% of electronic waste is completely recyclable
  • in 2014, Bitcoin had 99.8% fewer CO2 emissions than the banking system
  • in 2016, Bitcoin mining used 0.87% of the total US electricity consumption
    • 4.34 times the US transportation sector
    • 3.33% of the US industrial sector
    • 2.38% of the US commercial sector
  • the Bitcoin network and market share could scale millions of times over and it’s environmental impact would remain insignificant compared to legacy systems
  • a yearly mining electricity usage lower bound of 9.636 TWh (34.69PJ) has been calculated by one estimate
    • this lower bound could serve as a natural equilibrium that mining energy consumption may converge to, all else being equal (BTC price, technological innovation, etc.)
  • current (December 2017) Bitcoin mining’s yearly electricity consumption, by one estimate, is 32.56TWh (117.216PJ)
  • in 2017, Bitcoin mining CO2 emissions was ~9.2% that of the legacy banking sector
    • 2014 energy consumption relative to 2017: 0.70712TWh / 32.56TWh = 0.0217 ~= 2.2% (~46 times increase over the past 3 years)
    • 2017 Bitcoin CO2 emissions relative to banking industy’s: 0.002 * 46 = 0.092 = 9.2%
    • assuming that the banking industry hasn’t grown and that it uses the same percentage of renewable energy as Bitcoin miners, both of which are not the case
  • Bitcoin mining is already a driving force for accelerating the global transition to renewable energy and decentralized energy production
    • miners are shifting, large scale, to the cleanest forms of energy: geothermal, hydroelectric, natural gas, natural cooling, solar, wind
    • this is because, Bitcoin mining is location independent and renewable energy prices are far more stable and offer a long term hedge against fossil fuel costs
“Now, Bitcoin is an environmental subsidy to alternative energy all around the world because it’s causing these projects to be amortized over a year instead of five. Oh you’re telling me we were running a green coin all this time and I didn’t even notice!?… The decentralization of Bitcoin is driving the decentralization of energy production, which is one of the most important trends in human history… The level of security that we have for Bitcoin today is a level of security that can handle global attacks by colluding nation states: that’s the level of security that is needed for this system to remain censorship resistant. But if the system was 10 times bigger with 10 times more users, it doesn’t need 10 times more mining. It already has globally secure mining: what we have is enough. There’s a profit motive that drives it. But it’s a mistake to think that if we go global that cost will multiply; quite the opposite in fact. Over time the reward for mining decreases, and as a result, it’s more likely that we’ll see that gradually taper off and plateau.”
— Andreas Antonopoulos
Provided the overwhelming evidence above, it should be abundantly clear that Bitcoin’s triple bottom lines are in a class all their own when compared against the tremendously inefficient, costly, bloated, dirty, corrupt, thieving, criminal, and all-too-often blood-soaked legacy institutions of gold, fiat, and banking. In accordance with its founding principles, Bitcoin will sweep aside the curtains, open wide the gates, shine a light in the dark places, and drive the money-changers from the temple! The day of reckoning cometh…
By Landon Mutch

Wednesday, December 27, 2017

Oil and gas supply disruptions ripple around the world

Tight markets and wintry weather exacerbate the problem

CALL it the hydrocarbon equivalent of the butterfly effect. As oil and gas supplies tighten during the northern winter, disruptions as remote as a hairline fracture on a piece of Scottish pipeline, and an explosion in an Austrian natural-gas plant, have repercussions felt around the world.
Start with the pipeline. After Ineos, a chemicals company, detected a growing crack on a piece of pipe near Aberdeen, on December 11th it said it would shut the main Forties pipeline carrying North Sea oil and gas to Britain for weeks. The suspension of a pipeline carrying 450,000 barrels a day (b/d) of crude, in a global market of almost 98m b/d, would not normally be disruptive. Yet Brent crude, the benchmark for pricing much of the world’s seaborne crude, is itself partly priced on the flow of crude from 80 fields that feed the Forties pipeline, magnifying the impact.
Futures prices for Brent crude delivered in February and March surged to two-year highs, above $65 a barrel, before falling back. That emphasised how little slack the market has, after the extension last month of a production cut by OPEC, the producers’ cartel, Russia and other petrostates. Ann-Louise Hittle of Wood Mackenzie, a consultancy, says some European refineries rely on Brent crude to produce heating oil for sale in Germany and elsewhere. “Suddenly half a million barrels are out of action at a delicate time going into winter,” she says. Those refineries may now receive some shipments of American crude.
The mishap also highlighted the fragility of the Brent benchmark, which is priced based on demand for four types of crude produced in ageing North Sea fields running through pipelines dating from the 1970s. Earlier this year S&P Global Platts, an agency that assesses the Brent price, said it would incorporate from January a fifth crude from a Norwegian field, to ensure a more stable mix of production.
The pipeline also carries a tenth of Britain’s natural-gas supply. Stuart Elliot of S&P Global Platts says that, in Britain, wholesale gas prices surged by 40% following the shutdown, until terminals storing liquefied natural gas (LNG) disgorged some stock. Indicating the global reach of the incident, he says Britain may stock up on gas by buying a cargo from the first tanker bringing LNG from Yamal, a field in the Russian Arctic, which was inaugurated by President Vladimir Putin on December 8th. Much of its gas is destined for China.
As Britain struggled with its gas supplies, elsewhere in Europe had to cope with an explosion at the Baumgarten gas hub in Austria on December 12th that killed one person. It stopped the flow of Russian gas through Austria into Italy, sending day-ahead prices for such gas soaring. Italy, which depends on Russian gas for about a third of its consumption, declared a state of emergency. But later that night Russian gas reached Italy again after OMV, Baumgarten’s operator, diverted flows. Predictably, the Kremlin used the incident to press for more pipelines to Europe. But the EU is reluctant to lean too heavily on imports of Russian gas. It sees LNG, including from America, as a useful alternative that could enhance its energy security.

Tuesday, December 26, 2017

Intangible assets are changing investment

Forecasting profits is not as helpful as it used to be
WHEN you work as an equity analyst at an investment bank, your task is clear. It is to comb all the statements made by corporate executives, to scour the industry trends and arrive at an accurate forecast of the company’s profits. Achieve this and your clients will be happy and your bonus cheque will have many digits.
But is all this effort worthwhile? Not as much as it used to be, according to Feng Gu and Baruch Lev, writing in a recent issue of Financial Analysts Journal*. The authors imagined that investors could perfectly forecast the next quarter’s earnings for all companies. They then assumed that investors bought all the stocks that they expected to meet or beat the consensus of analysts’ forecasts; and that investors could short (ie, bet on a declining price) the stocks of those that were predicted not to reach their estimates. They made their investment two months before the end of a quarterly reporting period and got out of their positions one month after the quarter ended (by which time the earnings have been reported).
In the late 1980s and 1990s, this would have been a highly successful strategy, achieving excess returns (over those achieved by stocks of similar size) of 4% or more every quarter. But these abnormal returns have dropped: in recent years they have been only 2% a quarter. A similar effect appeared when examining the returns that would have been achieved by perfectly predicting those companies that achieved annual earnings growth.
Although an excess return of 2% a quarter would still be highly attractive, it would require a perfect forecasting record. That suggests the number-crunching performed by fallible analysts and investors produces much lower returns.
The intriguing question is why those returns have been falling. The authors argue that the decline is because of the rising importance of intangible investments in recent decades (in areas such as software or trademark development). Such investment may be a big driver of value growth.
Accountants have struggled to adapt. If a company buys an intangible asset, such as a patent, from another business, it is classed as an asset on the balance-sheet. But if they develop an intangible within the business, that is classed as an expense, and thus deducted from profits. As the authors note: “A company pursuing an innovation strategy based on acquisitions will appear more profitable and asset-rich than a similar enterprise developing its innovations internally.”
As a result, the authors argue, reported earnings are no longer such a good measure of a company’s profits, and thus may not be a useful guide to future share performance. To test this proposition, they divided companies into five quintiles based on their intangible investment. Sure enough, the more companies spent on intangibles, the lower the excess return available to those who correctly forecast the earnings.
The paper’s message echoes the themes of a new book** by Jonathan Haskel and Stian Westlake, which explores the impact of the growing importance of intangible assets in modern economies. The book finds a link between the poor productivity record of many leading economies since the crisis of 2008, and the sluggish rate of investment in intangible assets since then.
The problem is that intangibles have spillovers. A company may undertake expensive research and development, but the gains may be realised by other businesses. Only a few companies (the likes of Google) can achieve the scale needed to take reliable advantage of their intangible investments. Unlike machines and equipment, intangibles may have limited resale value. So the risks of failure may put businesses off intangible investment.
This is both good news and bad news for investors. On the one hand, it may explain why profits have remained high relative to GDP. In theory, high returns should have attracted a lot more investment and the resulting competition should have driven down profits. But the difficulty in exploiting intangibles may have prevented that. On the other hand, the reluctance of many businesses to invest in intangibles may restrict their scope for growth in future. Investors looking for growth stocks will face a restricted choice and such companies will be so apparent to everyone that they will command a very high valuation. Not so much the “nifty fifty” stocks that were fashionable in the early 1970s, as the nifty five or six.

Friday, December 22, 2017

Why is America more tolerant of inequality than many rich countries?

Ignorance about the scale of the problem is part of the answer
MOST Americans are unenthusiastic about Republicans’ efforts to reward the richest with the biggest tax cuts. In polls taken on the eve of a vote on the government's tax bill in the Senate on December 2nd only between a quarter and a third of voters supported the plan. But in general Americans seem more willing than the inhabitants of other rich countries to tolerate inequality.
Data from the Organisation for Economic Co-operation and Development (OECD) suggests that America is a relatively unequal country and that the government does comparatively little to redress the balance. The most common measure of inequality, the gini coefficient, takes a value between zero (if everyone earned exactly the same) and one (if all income were earned by one person). America’s gini before taxes and transfers was 0.47 compared with the OECD average of 0.43. After taxes and transfers, America’s gini falls to 0.39. The OECD average is 0.31. In 2014, taxes and transfers reduced American inequality by a mere 18%; this compares with 25% in Britain, 29% in Germany and 34% in France.
Americans appear to be less averse to inequality than citizens of other rich countries. Lars Osberg and Insa Bechert of Dalhousie University found that the most inequality-averse 10% of Americans resemble the inequality-averse in other countries, favouring an earnings ratio between CEOs and unskilled labourers of about two to one. From there the gap widens: the most inequality-tolerant Americans see the ideal ratio as 50 to one; compared with 24 to one amongst the most inequality-tolerant in Britain. In Sweden the figure is five to one.
Why the difference? One reason may be that Americans don’t realise how unequal incomes are. In common with the inhabitants of other wealthy countries, most Americans believe there is too much inequality. But they underestimate just how much of it there is. The average American puts the current ratio of CEO to unskilled worker pay at thirty-to-one; their preference is for about seven-to-one. But the actual CEO-unskilled wage ratio in America is 354 to one.
Ignorance about the scale of inequality is a global phenomenon. In a new paper in Economics and Politics Vladimir Gimpelson and Daniel Triesman write that across countries there is only a tenuous relationship between (post-transfer) inequality and perceived inequality. And research suggests that those who have a more realistic understanding of inequality worry more about it. Michael Norton and Sorapop Kiatpongsan of Harvard and Chulalongkorn Universities found that those who strongly agree with the idea that differences in incomes are too large estimate the CEO-worker wage gap at 12.5 to one. Those who strongly disagree estimate the gap at 6.7-to-one. There is broad agreement about the “ideal” income gap between these groups (which ranges between four to one and five to one); the difference is over what they believe the ratio actually is.
A second reason Americans may differ in their view of inequality is that they seem not to trust the government to fix the problem—or to believe that this is part of its job. The researchers from Dalhousie University suggest that American respondents tend to be more sceptical about the role played by government in reducing inequality. And when Jan Zilinsky at the University of Chicago randomly exposed a sample of Americans to information about inequality in America, it made them depressed about the issue but no more likely to support cash transfers to the poor. Most Americans may dislike a tax bill that increases inequality. But that does not mean they would support one that did the opposite. 

Thursday, December 21, 2017

Countries rarely default on their debts

Venezuela is the exception to the rule

VENEZUELA is an unusual country. It is home to the world’s largest reserves of oil and its highest rate of inflation. It is known for its unusual number of beauty queens and its frightening rate of murders. Its bitterest foe, America, is also its biggest customer, buying a third of its exports.
In defaulting on its sovereign bonds last month (it failed to pay interest on two dollar-denominated bonds by the end of a grace period on November 13th), Venezuela is also increasingly unusual. The number of governments in default to private creditors fell last year to its lowest level since 1977, according to the Bank of Canada’s database. Of the 131 sovereigns tracked by S&P Global, a rating agency, Mozambique is the only other country in default, having missed payments on its Eurobond (and failed to make good on guaranteed loans to two state-owned enterprises). Walter Wriston, a former chairman of Citibank, earned ridicule for once declaring that “countries don’t go bust”. But they don’t much anymore.
This dearth of distress is surprising, given the turmoil emerging economies have endured in recent years. The collapse in commodity prices that undid Venezuela was accompanied by a sharp reversal of capital flows to emerging economies that began in 2011 and gathered pace during the “taper tantrum” of 2013. There have been 14 such capital “busts” in the past 200 years, according to Carmen Reinhart of Harvard University, Vincent Reinhart of Standish Mellon Asset Management and Christoph Trebesch of the Kiel Institute for the World Economy. The most recent bust was the second-biggest of the lot. But it led to less distress than usual. If past patterns had held, such a severe setback would have resulted in 15-20 more defaults than actually transpired, the three scholars calculate.
What explains these “missing” defaults? Some may be hidden. China, for example, may have rescheduled or replenished some of its sizeable loans to emerging economies without ever declaring them bad. Indeed, China’s willingness to roll over its loans to Venezuela delayed, even if it did not ultimately prevent, the Bolivarian republic’s default on some of its other debts.
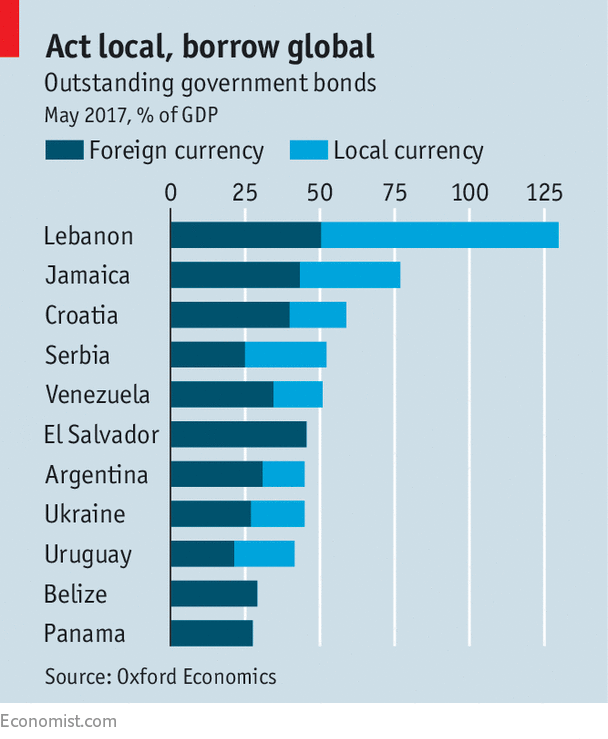
Distress also now manifests itself in other ways, points out Gabriel Sterne of Oxford Economics, a consultancy. The governments of emerging economies increasingly borrow in their own currencies. These are no longer tightly pegged to the dollar, as many were in the 1980s and 1990s, or to gold, as in the 19th century. Of 54 emerging markets Mr Sterne has examined, only 11 have foreign-currency bonds worth more than 20% of their GDP (see chart). So defaulting on hard-currency debt is neither as necessary nor as helpful as it was. Even if a sovereign were to forswear a big chunk of its dollar obligations, imposing a steep loss on creditors, it would only save a large percentage of a small amount.
The costs of default, on the other hand, are somewhat fixed. Default is, in legal terms, a discrete event. Reneging on debt worth 10% of GDP may be just as damaging to a country’s reputation as reneging on debt worth twice as much. And the costs are not just financial. “You have to negotiate with the creditor committees. You’re going to get all the hedgies (hedge funds) potentially ganging up on you. And that’s a pain in the backside,” notes Mr Sterne. In a growing number of emerging markets, including past offenders like Brazil, Mexico and Peru, default on foreign-currency debt is no longer imaginable, he says.
What about the local-currency securities that have grown in importance? Since governments have the power to print the money they owe on these bonds, default is never technically necessary. Currency depreciation and inflation offer a more surreptitious way to erode creditors’ claims: less discrete, more discreet.
Ukraine offers one instructive example, argues Mr Sterne. The holders of its foreign-currency debt emerged largely unscathed from its wartime wobbles (generous coupon payments more than offset a 15% cut in the net present value of their claims). On the other hand, those unlucky enough to hold bonds or deposits denominated in Ukrainian hryvnia suffered a 30% loss in dollar terms, by his calculations.
Although default on local-currency bonds is never technically necessary, is it nonetheless possible? The rating agencies think so, reserving triple-A ratings for only a small fraction of such bonds. And even the financial markets perceive some danger of default. The yield they demand on this government paper is higher than the implicit “risk-free” rate that can be calculated from currency swaps, point out Wenxin Du of the Federal Reserve and Jesse Schreger of Columbia Business School.
In some cases, the two economists argue, a government may prefer default to the alternatives of depreciation and inflation. Suppose, for example, that the country’s companies have borrowed heavily in dollars, even if the government itself has not. In such scenarios, a falling currency may wreak more economic havoc than a formal breach of government obligations.
Venezuela again provides a cautionary example. It has so far kept up payments on its local-currency debt, retaining a stronger credit rating on these liabilities than on its dollar paper. Meanwhile the country is going to ruin. Much of the population cannot afford enough food, medicines must be smuggled in from Colombia, and the currency lost 60% of its value last month. The republic may not have defaulted on its local debt. But it has defaulted most violently on its social contract.