Many people are concerned that we have an oil problem. Or they are concerned about recession and the need to lower interest rates.
As I see the situation, we have a problem of a networked economy that is not functioning well. A big part of this problem is energy-related. Strange as it may seem, energy prices (including oil prices) are too low for producers. If debt levels were growing more rapidly, this low-price problem would go away.
The “standard way” of encouraging more debt-based purchases is by lowering interest rates. But we are running out of room to do this now. We also seem to be running out of economic investments to make with debt. If expected returns on investment were greater, interest rates would be higher.
Without economic investments, demand for commodities of all kinds, including energy products, tends to stay too low. This is the problem we have today. Our debt problem and our energy problem are really different aspects of a networked economy that is no longer generating enough total return. History suggests that these periods tend to end badly.
In the following sections, I will explain some of the issues involved.
[1] Our problem is not just that oil prices that are too low. Prices are too low for practically every type of energy producer, and in many parts of the globe.
Oil: OPEC oil producers have cut back production because they view oil prices as too low. OPEC reports a cutback in production of 2.7 million barrels per day between November 2018 and July 2019 (from 32.3 million bpd to 29.6 million bpd).
In the US, there has been an increase in bankruptcies of oil producers during 2019, relative to 2018. There has also been a reduction in the number of oil drilling rigs of 17% since the week of November 16, 2018, according to reports by Baker Hughes. These are signs of producer distress.
Natural gas: While recent US natural gas prices have bounced up off their recent lows, as recently as August 8, 2019, we were reading:
U.S. gas futures this week collapsed to a three-year low, while spot prices were on track to post their weakest summer in over 20 years. In other markets, such lackluster pricing would cause investment to retrench and supply to contract.But gas production is at a record high and expected to keep growing. Demand is rising as power generators shut coal plants and burn more gas for electricity, and as rapidly expanding liquefied natural gas (LNG) terminals turn more of the fuel into super-cooled liquid for export.Analysts believe the natural gas market is not trading on demand fundamentals because supply growth continues to far outpace rising consumption. Energy firms are pulling record amounts of oil from shale formations and with that oil comes associated gas that needs either to be shipped or burned off.
When we look worldwide, we see that the Wall Street Journal is reporting, “U.S. Glut in Natural Gas Supplies Goes Global.” A chart from that article shows falling natural gas prices in Europe and Asia, almost to the level of US natural gas prices.
Coal: The US Energy Information Administration writes, “More than half of US coal mines operating in 2008 have since closed.” USA Today writes, “Is President Trump losing his fight to save coal? Third major company since May files for bankruptcy.”
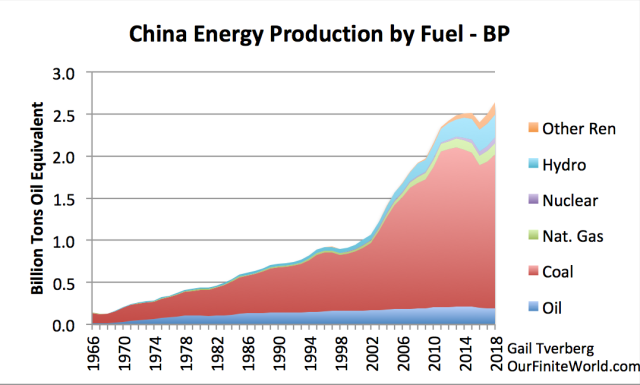
China has also been closing coal mines in response to low prices. Its coal production ramped up quickly after it joined the World Trade Organization in 2001, but since the 2012 to 2013 period, production has been close to level. An academic paper talks about a “de-capacity program” undertaken in China in 2016 in response to plunging coal prices and overall financial loss of coal enterprises.
Figure 1. China energy production by fuel, based on 2019 BP Statistical Review of World Energy data. “Other Ren” stands for “Renewables other than hydroelectric.” This category includes wind, solar, and other miscellaneous types, such as sawdust burned for electricity.
Uranium: A recent article says, “Plummeting global uranium prices hit Namibia hard.” Another article talks about the huge amount of capacity that has been taken off-line because of continued low uranium prices. The article estimates that 25% to 35% of global uranium production had already been taken off-line by the time the article was published (May 20, 2019).
Ethanol: According to the Wall Street Journal, the ethanol industry has been losing money since at least 2015, and is now closing ethanol plants in three states. The trade war has exacerbated its problems, but clearly its problems began before the trade war.
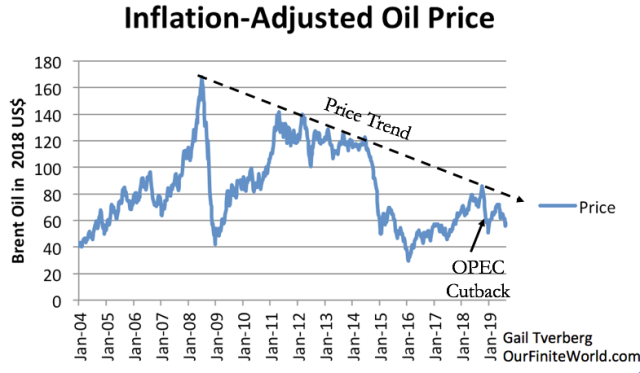
[2] The general trend in oil prices has been down since 2008. In fact, a similar trend applies for many other fuels.
Figure 2 shows that oil prices since 2008 have been trending downward.
Figure 2. Inflation adjusted weekly average Brent Oil price, based on EIA oil spot prices and US CPI-urban inflation.
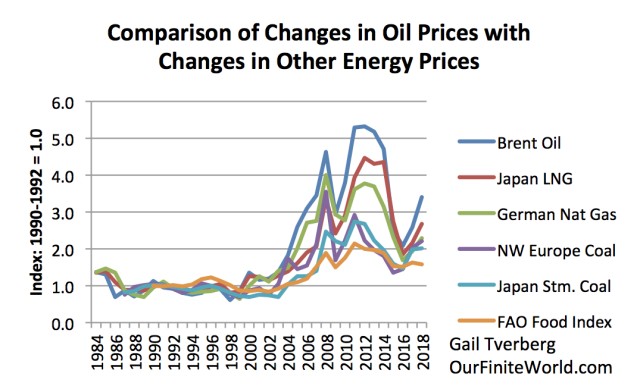
Figure 3 shows that other energy prices have been following a similar price trend to those of oil. This situation happens because energy products are primarily used in finished goods and services of many kinds, such as cars, homes, vacation travel, and air conditioning. If demand for finished goods and services is high, prices for all commodities can be expected to be high; if demand for finished goods and services is low, prices for all commodities can be expected to be low. Thus, it shouldn’t be too shocking that the problem of prices that are too low for energy producers is very widespread.
Figure 3. Comparison of changes in oil prices with changes in other energy prices, based on time series of historical energy prices shown in BP’s 2019 Statistical Review of World Energy. The prices in this chart are not inflation-adjusted. They are annual averages, so smooth out quite a few smaller bumps.
[3] The situation of prices being too low for many types of energy producers simultaneously is precisely the problem I found back in December 2008 when I wrote the article Impact of the Credit Crisis on the Energy Industry – Where Are We Now?
The article mentioned was written in December 2008. If we look back at Figure 2, this was a time when oil prices were very low. I had first noticed a cutback in credit of various kinds (including credit card debt and mortgage debt) in the middle of 2008, about the time oil prices crashed. Later in the year, additional financial problems emerged, including the collapse of Lehman Brothers. Banks became less willing to offer credit to buyers who were deemed insufficiently creditworthy.
In my December 2008 article, I talk about suppliers in various supply chains not being able to get credit. Without credit, supply chains could not operate. Businesses depending on supply chains were forced to cut back on their purchases. In fact, some suppliers went bankrupt. Workers were laid off in this process; these layoffs added to the lack of buyers for finished goods and services. Energy prices of many types crashed simultaneously because of the “lack of demand” for commodities used to make finished products of many kinds.
The fix back for the problem in late 2008 was for the US to begin Quantitative Easing. Quantitative Easing lowered longer-term interest rates and allowed more credit to get back to supply chains. By 2011, oil prices had risen to a level that was more tolerable for producers. These higher prices slowly slipped away, especially disappearing when the US discontinued its Quantitative Easing program in 2014.
If a person looks at the late 2008 situation, it is clear that a lack of debt availability indirectly led to low commodity prices. Prices dropped almost straight down, when the debt bubble popped. This time, the situation is a little different. We arrived at low prices through the long diagonal black dotted line on Figure 2; this time other factors besides an obvious lack of debt have been involved.
One issue that seems to be involved this time is changing relativities between the dollar and other currencies, making energy products more expensive for those outside the US.
A second contributing issue this time is growing wage disparities, as goods are increasingly manufactured in low-wage countries. Low-wage workers (both in developing countries and in advanced economies trying to compete with developing countries) are less able to buy finished goods and services. This contributes to the lack of demand for finished goods and services using commodities of all kinds, including energy products.
[4] In the right circumstances, a rapidly growing supply of cheap energy products can help the world economy grow.
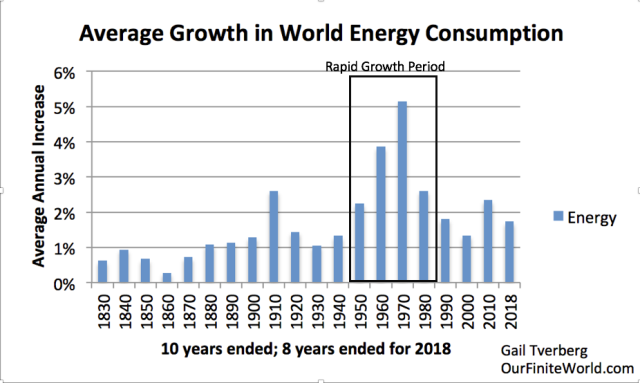
If we look back, there was a period of rapid growth in the world’s energy consumption between World War II and 1980. This was a period of rapid growth in the world economy.
Figure 4. Average growth in energy consumption for 10 year periods, based Vaclav Smil estimates from Energy Transitions: History, Requirements and Prospects (Appendix) together with BP Statistical Data for 1965 and subsequent.
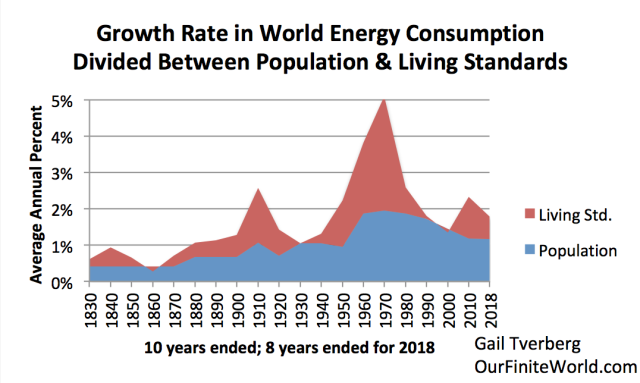
In fact, both population and energy consumption per capita were growing. This growing energy consumption per capita allowed living standards to grow as well (Figure 5).
Figure 5. Energy growth amounts shown in Figure 4, divided between amount that supported population growth (based on 2019 world population estimates and earlier estimates by Angus Maddison) and all other, which I have called “living standards.”
Most people would agree that a major increase in living standards took place between World War II and 1980. New buildings were constructed to replace those destroyed or damaged during World War II. Many people were able to buy cars for the first time. Interstate highway systems were built. Electric transmission lines were built, and oil and gas pipelines were laid. In rural areas, homes were often electrified for the first time. With the aid of energy saving appliances and birth control pills, many women joined the workforce. The US, Europe, Japan, and the Soviet Union all saw their economies grow.
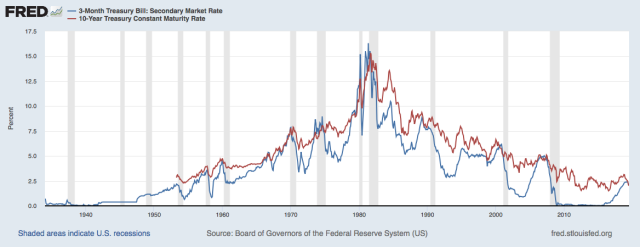
[5] It is striking that the period of rapid energy consumption growth between World War II and 1980 corresponds closely to the long-term rise in US interest rates between the 1940s and 1980 (Figure 6).
Figure 6. Three-month and ten-year interest rates through July 2019, in chart by Federal Reserve of St. Louis.
If interest rates rise, it becomes more expensive to borrow money. Monthly payments for homes, cars, and new factories all rise. Evidently, the US economy was growing robustly enough in the 1940 to 1980 timeframe that US short term interest rates could be raised without much economic harm. The big concern seemed to be an overheating economy as a result of too rapid growth.
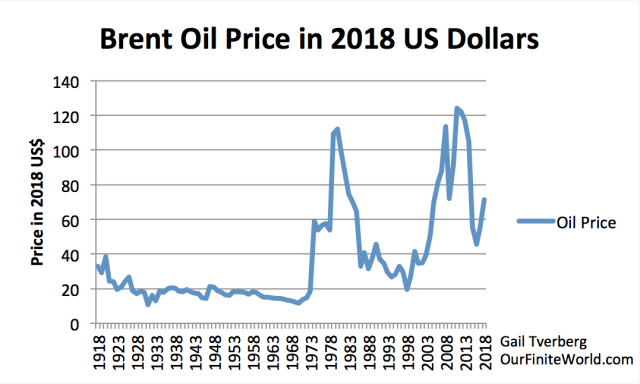
The huge increase in interest rates in 1980-1981 put an end to any concern about an overheating economy (Compare Figures 6 and 7). Oil prices came back down once the world economy was in recession from these high interest rates.
Figure 7. Historical inflation-adjusted Brent-equivalent oil prices based on data from 2019 BP Statistical Review of World Energy.
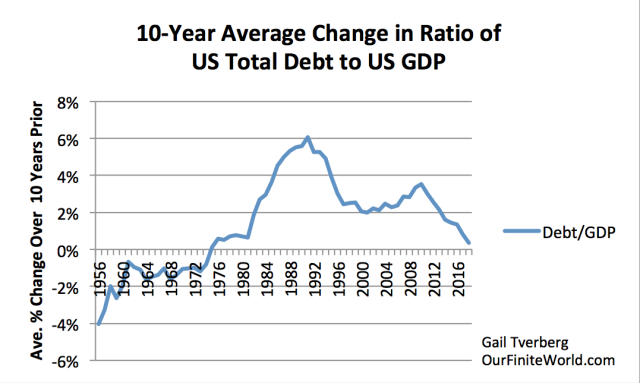
[6] Starting about 1980, the US economy began substituting rapidly growing debt for rapidly growing energy supplies. For a while, this substitution seemed to pull the economy forward. Now growth in debt is failing as well.
Figure 8 shows how the ratio of total US debt (including governmental, household, business and financial) has changed since 1946. It becomes clear that once the big “push” that the economy received from rising consumption of energy products began to fall about 1980, the US moved to the addition of debt as a substitute.
Figure 8. Ten-year average increase in US debt relative to GDP. Debt is “All Sectors, Liability Level” from FRED; GDP is in dollars of the day.
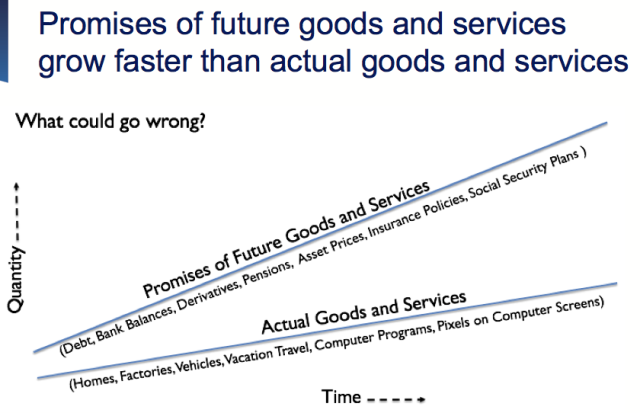
I think of debt as being one of many kinds of promises. Figure 9 illustrates that while the total amount of goods and services has been growing, debt levels and other kinds of promises have been growing even more rapidly.
Figure 9. Promises of future goods and services tend to rise much more rapidly than actual goods and services. Chart by Gail Tverberg.
Many things can go wrong with this system. If the growth in added debt slows too much, we can expect to start seeing financial problems similar to those we saw in 2008. Also, if the level of debt (such as student debt) gets too high, its payback interferes with the purchase of other needed goods, such as a home. If energy providers decide prices are too low and stop producing, then promised Future Goods and Services can’t really appear. Huge defaults on promises of all kinds can be expected. This happens because the laws of physics require the dissipation of energy for physical processes underlying GDP growth.
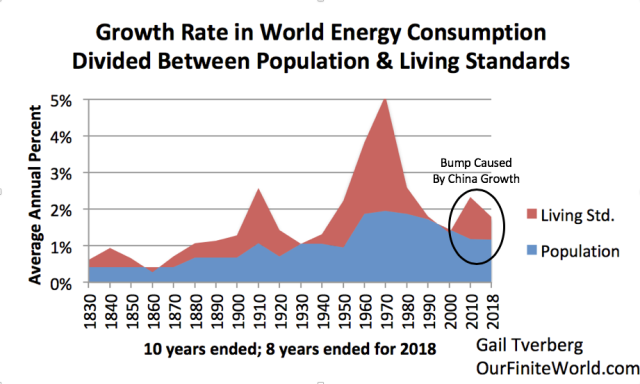
[7] Since 2001, world economic growth has been pulled forward by China with its growing coal supply and its growing debt. In the future, this stimulus seems likely to disappear.
Figure 10. Figure similar to Figure 5, with bump that is primarily the result of China’s accelerated growth circled.
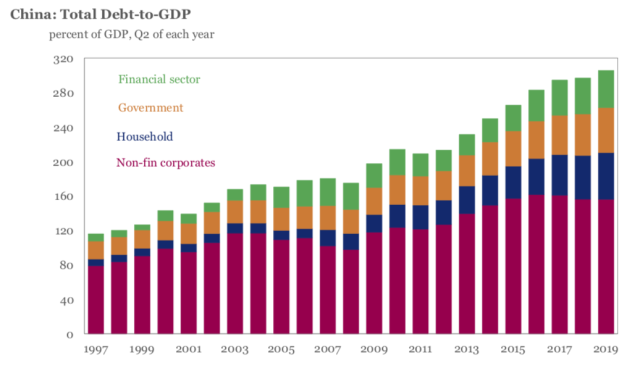
China has been financing its rapid economic growth since 2001 with growing debt.
Figure 11. China Debt to GDP Ratio, in figure by the IIF.
We know that low prices for coal have led to flattening production since the 2012 – 2013 period (Figure 1). In fact, part of the reason for the flattening of non-financial corporate debt in recent years in Figure 11 may reflect swaps of uncollectible coal mine debt for equity, removing part of coal mine debt from the chart.
The failure of coal production to grow rapidly puts China at an economic disadvantage because coal is a very low-cost energy source. Any substitution, even imported coal, is likely to raise its cost of making goods and services. This makes competition in a world economy more difficult. And China’s debt level is already very high, putting it at risk of the problems discussed in Section [6].
[8] The world economy needs much more rapidly growing debt if energy prices are to rise to a level that is acceptable to energy producers.
Debt acts like a promise of future goods and services. Growing debt, plus increases in other types of promises of future goods and services, helps to keep energy prices high enough for energy producers. There are at least three reasons that growing debt helps an economy:
First, increasing debt can be used to build factories, and these factories hire large numbers of people. The factories utilize various raw materials and energy products themselves, raising demand for goods and services. Furthermore, the workers hired by the factories, with their incomes from their jobs, also raise the demand for goods and services. These goods and services are made with commodities. Growing debt thus raises demand for commodities, and thus their prices.
Second, increasing debt levels by governments are often used to hire workers or to raise benefits for the unemployed or the elderly. This has a very similar effect to building new factories. These workers and these beneficiaries can afford more goods and services, and these goods and services are made using commodities. Governments also use some of their funds to build schools, pave roads and operate police cars. All of these things require energy consumption.
Third, consumers can afford to buy more of the output of the economy, if their debt levels are increased. If debt can be structured so that anyone who walks into a car dealership can afford a new car (such as longer durations, lower interest rates, and no down payment), this added debt allows increasing demand for new cars. It also allows increasing demand for the energy products used to make and operate these new vehicles. Furthermore, if new homes can be made more affordable for young people, this works in the direction of adding more mortgage debt.
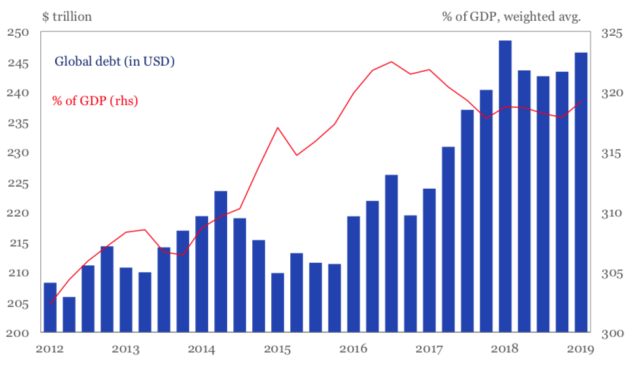
The Institute of International Finance (IIF) reports that the ratio of world debt to GDP (red line on Figure 12) has been falling since 2016. This falling ratio of debt to GDP no doubt contributes to the low-priced energy problem with which energy producers are now struggling.
Figure 12. IIF figure showing total world debt and the ratio of total world debt to GDP.
Non-debt promises of many types can also have an impact (including ones not listed on Figure 9) on energy prices, but it is beyond the scope of this article to discuss their impact.
[9] The world economy seems to be running out of truly productive uses for debt. There are investments available, but the rate of return is very low. The lack of investments with adequate return is a significant part of what is preventing the economy from being able to support higher interest rates.
In a self-organizing networked economy, market interest rates (especially long-term interest rates) are determined by the laws of physics. Regulators do have some margin for action, however. They can raise or lower certain short-term term interest rates. They can use also their central banks to purchase existing securities, thereby influencing both short- and long-term interest rates. In addition, they can indirectly affect the system by raising and lowering tax rates and by adopting stimulus programs.
Market interest rates, in some sense, tell us how productive investments truly are at a point in time. Years ago, investments that the economy was able to make were far more productive than the investments we are making today. For example, the first paved road in an area had a huge beneficial effect. New roads were able to open whole areas up to commerce. Once an area had been developed, later investments were much less beneficial. Fixing up a road that has many holes in it takes energy and materials of many types, but it doesn’t really add productivity to the system. It just keeps productivity from falling.
After a point, adding new roads or other infrastructure doesn’t add much of anything. This is especially the case if population is level or falling. If population is falling, it would likely make sense to reduce the number of roads, but this is difficult to do, once there are a few occupied homes along a road.
As another example, a car that gets a person from home to work is a great addition if the vehicle allows the person to take a job that he could not otherwise take. But added “bells and whistles” on cars, such as air conditioning, a musical system, sturdier bumpers, and devices to reduce emissions are of more questionable value, viewed from the point of view of allowing the economy to function cheaply and efficiently.
Another type of investment is education. At one point, a high school education was sufficient for the vast majority of the population. Now additional years of schooling, paid for by the student himself, are increasingly expected. An investment in higher education can be “productive,” in the sense of keeping the student from having to take the low-paying jobs that those without advanced degrees are forced to take. But for society as a whole, it is the complexity of the system that is forcing the need for extra education upon us. In a sense, the extra education is a tax we are required to pay for having a more complex system.
The need for pollution control might be considered another kind of tax on the system.
Our hugely expensive health care system is another tax on the system. After paying the cost of health care, workers have less funding available for buying or renting a home, raising a family, food and transportation.
[10] Since 1981, regulators have been able to prop up the economy by reducing interest rates whenever economic growth was faltering. Now we have pretty much run out of this built-in source stimulus.
Many observers have noted that central bankers are running out of tools to fix our economic problems. The lack of room to take down interest rates can be seen in Figure 6.
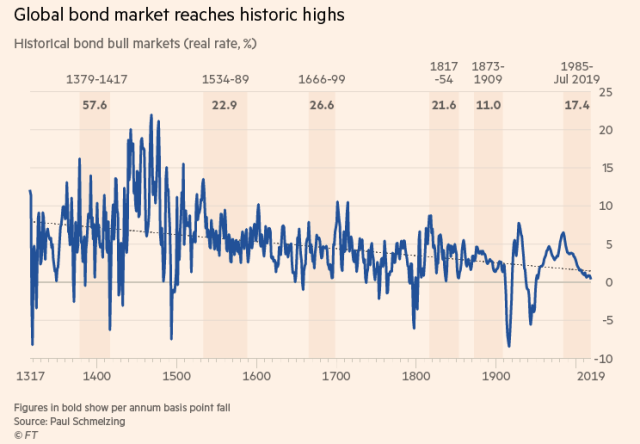
Figure 13 shows that long-term patterns of reductions in interest rates (darker bands) have happened previously. These reductions in interest rates came to an end because they couldn’t go any lower, given inflation expectations and likely levels of defaults. We seem to be facing a similar situation today.
Figure 13. Chart from the Financial Times showing historic interest rates and periods during which interest rates fell.
According to Figure 13, there have been three periods of falling interest rates in the last 200 years:
- 1817-1854
- 1873-1909
- 1985-2019
In the gap between the first two takedowns in interest rates (1854 to 1873), the US Civil War took place. This was a period of very poor return on investments. Somehow it ended in war.
Immediately after the second takedown in interest rates (after 1909), the world entered a very unstable period. First there was World War I, then the Great Depression, followed by World War II.
Now we are facing the possibility of yet another end-point for the take-down in interest rates.
[11] The total return of the economy seems to be too low now. This seems to be why we have problems of many types, ranging from (a) low interest rates to (b) low profitability for energy producers to (c) too much wage disparity.
All of the problems listed above are manifestations of an economy that is not producing sufficient total return. The laws of physics distribute the problem to many areas of the economy, simultaneously.
A person wonders what could be ahead. We seem to be reaching the end of the line regarding the takedown of interest rates, as shown in Figure 13. If a takedown in interest rates is possible, it acts as a relief valve for some of the other problems the economy is facing, including too much wage disparity and energy prices that are too low for producers.
In Section [10], we saw that when the relief valve of lower interest rates had disappeared, wars and depressions have taken place. We can’t know the precise outcome this time, but our current situation doesn’t look good. Will we encounter wars, or a serious depression, or financial problems worse than 2008? We can’t know for certain. Or will we somehow find a way around serious problems?
by Tyler Durden
by Tyler Durden
No comments:
Post a Comment
Note: Only a member of this blog may post a comment.