A couple of years ago, I wrote an article discussing the disconnect between the markets and the economy. At that time, the Fed was early into their rate hiking campaign. Talks of tax cuts from a newly elected President filled headlines, corporate earnings were growing, and there was a slew of fiscal stimulus from the Government to deal with the effects of 3-major hurricanes and 2-devastating wildfires. Now, the Fed is cutting rates, so it is time to revisit that analysis.
Previously, the consensus for the rise in capital markets was the tax cuts, and low levels of interest rates made stocks the only investment worth having.
Today, rates have risen, economic growth both domestically and globally has weakened, and corporate profitability has come under pressure. However, since the Fed is cutting rates, hinting at expanding their balance sheet, and a “trade deal” is at hand, stocks are the only investment worth having.
In other words, regardless of the economic or fundamental backdrop, “stocks are the only investment worth having.”
I am not so sure that is the case.
Let’s begin by putting the markets into perspective.
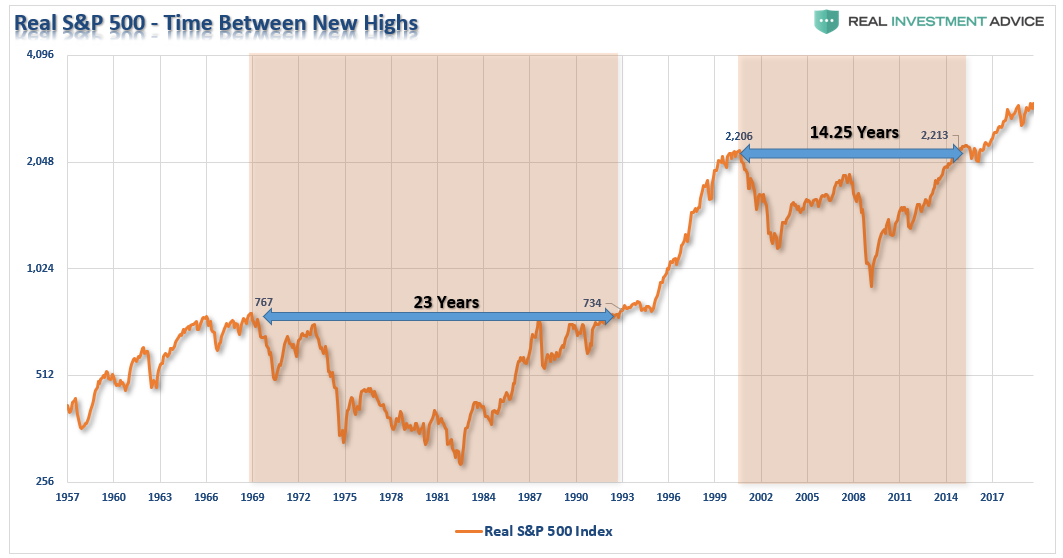
Yes, the markets are flirting with “all-time highs.” While this certainly sounds impressive, for many investors, they have just started making money on their investments from the turn of the century. As we noted in “The Moment You Know You Know, You Know,” what is often forgotten is the massive amount of “time” lost in growing capital to meet retirement goals.
This is crucially important to understand as was something I addressed in “Stocks – The Great Wealth Equalizer:”
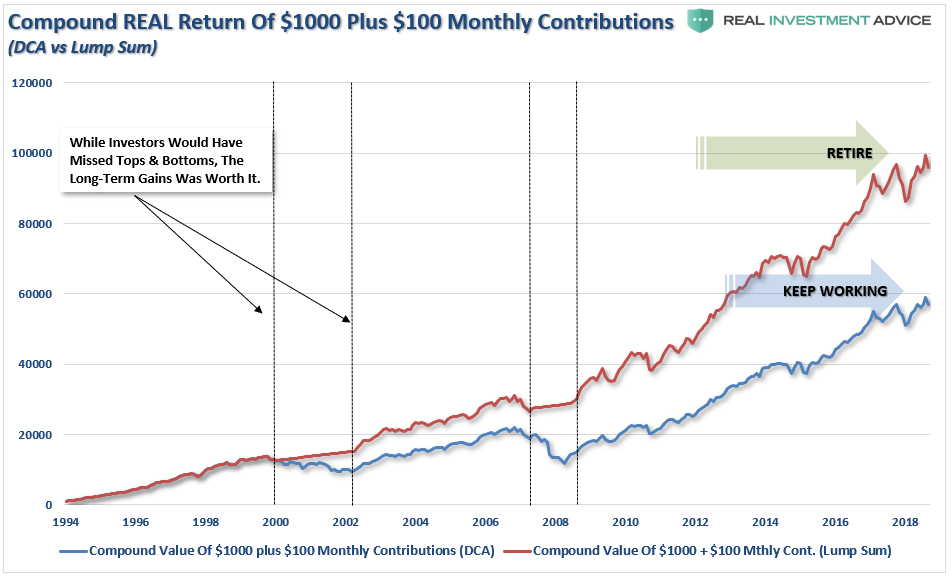
“By the time that most individuals achieve a point in life where incomes and savings rates are great enough to invest excess cash flows, they generally do not have 30 years left to reach their goal. This is why losing 5-7 years of time getting back to “even” is not a viable investment strategy.The chart below is the inflation-return of $1000 invested in 1995 with $100 added monthly. The blue line represents the impact of the investment using simple dollar-cost averaging. The red line represents a “lump sum” approach. The lump-sum approach utilizes a simple weekly moving average crossover as a signal to either dollar cost average into a portfolio OR moves to cash. The impact of NOT DESTROYING investment capital by buying into a declining market is significant.”
“Importantly, I am not advocating “market timing” by any means. What I am suggesting is that if you are going to invest into the financial markets, arguably the single most complicated game on the planet, then you need to have some measure to protect your investment capital from significant losses.While the detrimental effect of a bear market can be eventually recovered, the time lost during that process can not. This is a point consistently missed by the ever bullish media parade chastising individuals for not having their money invested in the financial markets.”
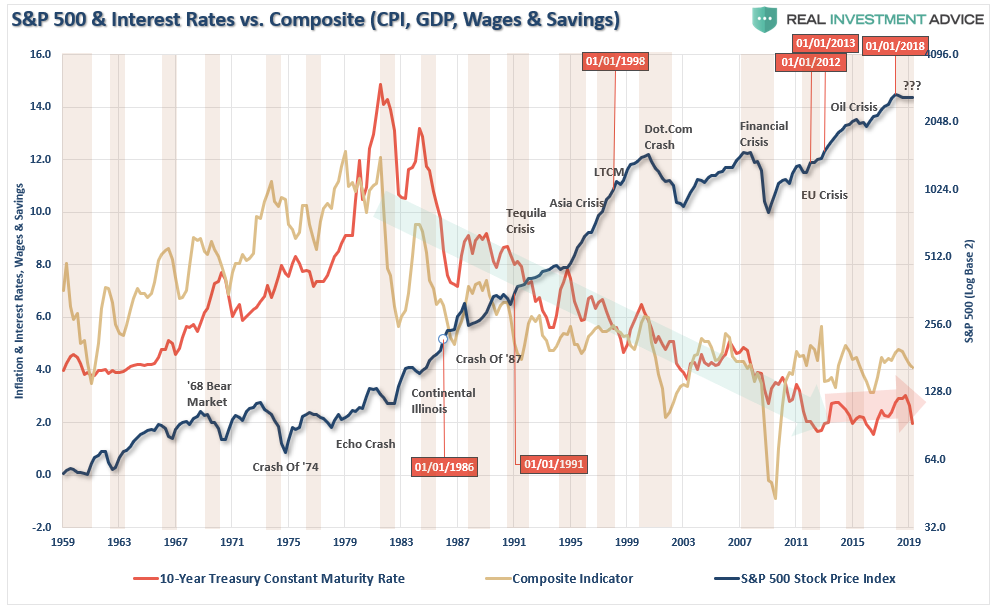
However, let’s set aside that point for the moment, and discuss the validity of the argument of the rise of asset prices is simply a reflection of economic strength.
Assuming that individuals are “investing” in companies, versus speculating on price movement, then the investment process is a “bet” on future profitability of the company. Since, companies derive their revenue from consumption of their goods, products, and services; it is only logical that stock price appreciation, over the long-term, has roughly equated to economic growth. However, during shorter time-frames, asset prices are affected by investor psychology which leads to “boom and bust” cycles. This is the situation currently, which can be seen by the large disconnect between current economic growth and asset prices.
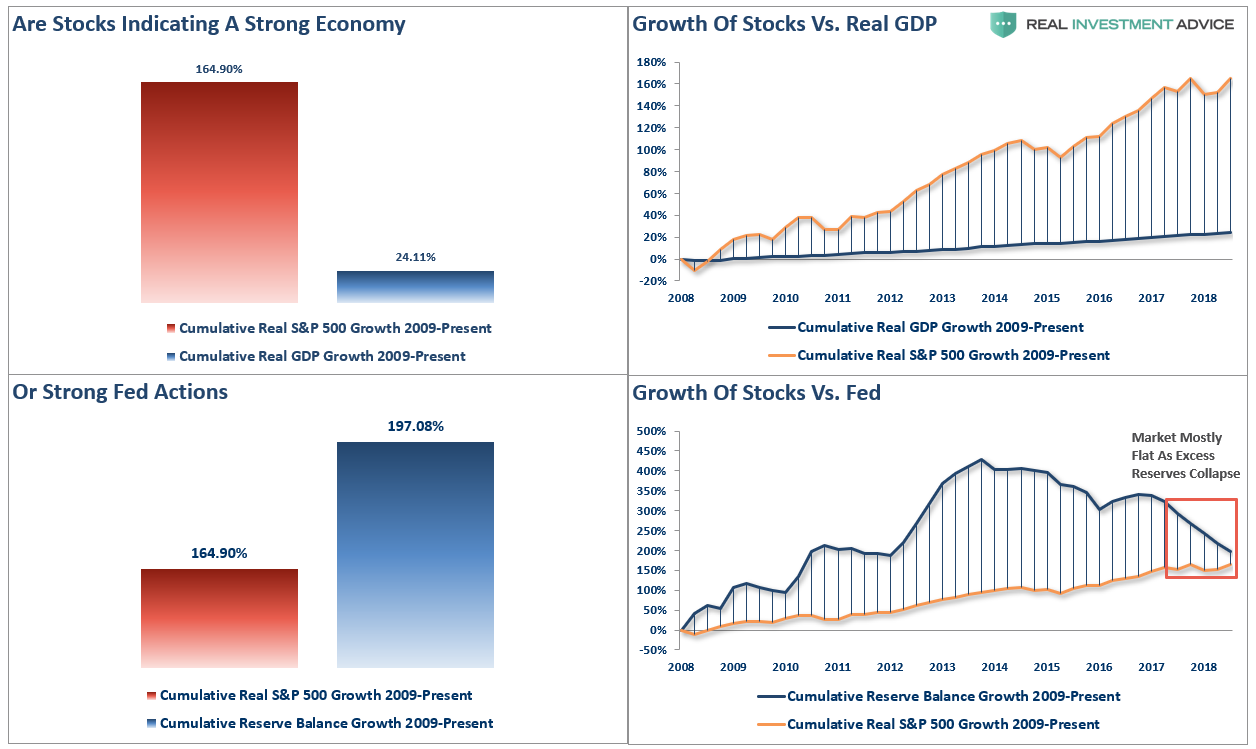
Since January 1st of 2009, through the end of the second quarter of 2019, the stock market has risen by an astounding 164.90% (inflation-adjusted). However, if we measure from the March 9, 2009 lows, the percentage gain explodes to more than 200%. With such a significant gain in the financial markets, we should see a commensurate indication of economic growth.
The reality is that after 3-massive Federal Reserve driven “Quantitative Easing” programs, a maturity extension program, bailouts of TARP, TGLP, TGLF, etc., HAMP, HARP, direct bailouts of Bear Stearns, AIG, GM, bank supports, etc., all of which total more than $33 Trillion, the economy grew by just $3.87 Trillion, or a whopping 24.11% since the beginning of 2009. The ROI equates to $8.53 of interventions for every $1 of economic growth.
Not a very good bargain.
We can look at this another way.
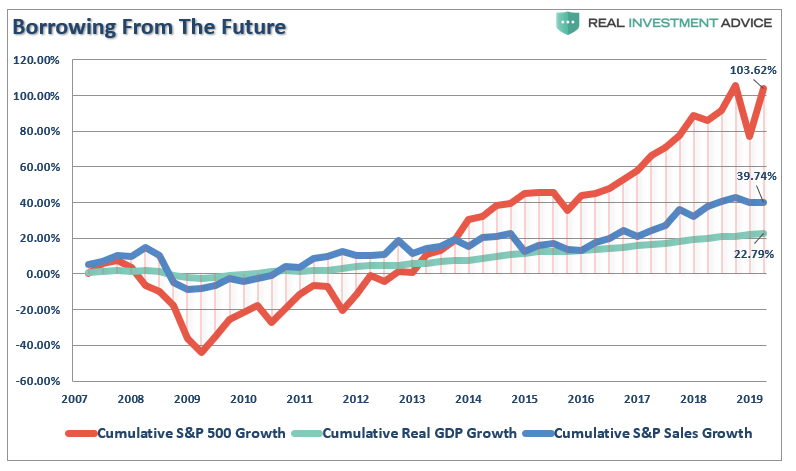
The stock market has returned almost 103.6% since the 2007 peak, which is more than 4-times the growth in GDP and nearly 3-times the increase in corporate revenue. (I have used SALES growth in the chart below as it is what happens at the top line of income statements and is not AS subject to manipulation.)
The all-time highs in the stock market have been driven by the $4 trillion increase in the Fed’s balance sheet, hundreds of billions in stock buybacks, and valuation (PE) expansion. With Price-To-Sales ratios and median stock valuations near the highest in history, one should question the ability to continue borrowing from the future?
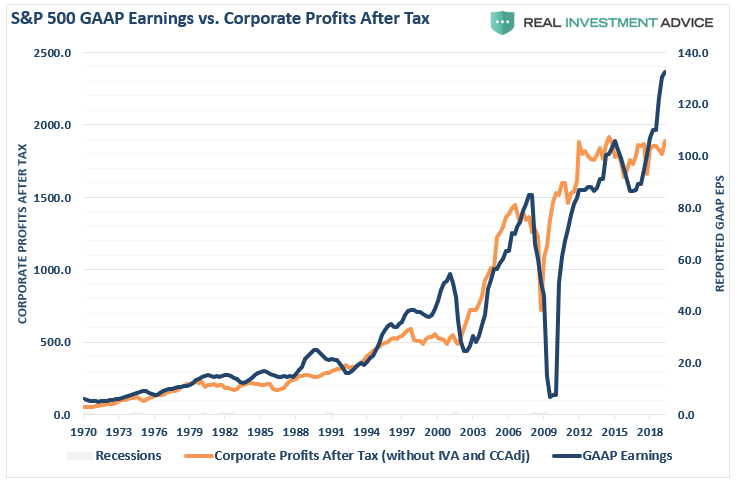
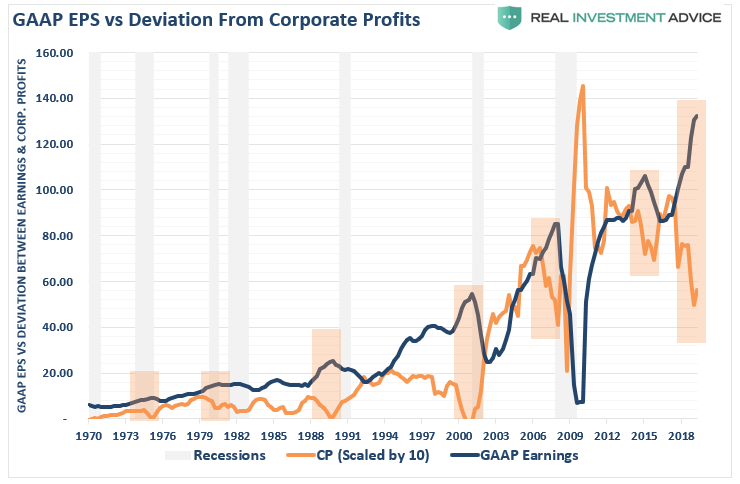
Speaking of rather extreme deviations, another concern for the detachment of the markets from more basic economic realities, the deviation of reported earnings from corporate profits after-tax, is at historical extremes.
These sharp deviations tend to occur in late market cycles when “excess” from speculation has reached extremes. Recessions tend to follow as a “reversion to the mean“ occurs.
While, earnings have surged since the end of the last recession, which has been touted as a definitive reason for higher stock prices, it is not all as it would seem.
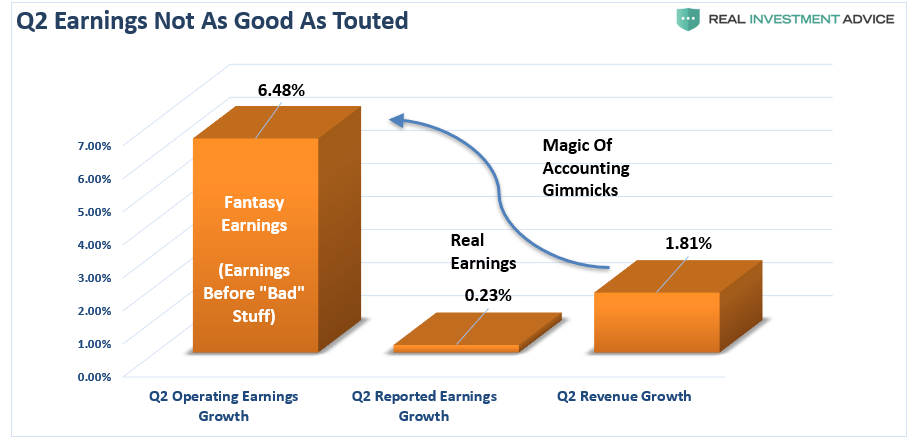
Earnings per share are indeed an important driver of markets over time. However, the increase in profitability has not come strong increases in revenue at the top of the income statement. The chart below shows the deviation between the widely touted OPERATING EARNINGS (earnings before all the “bad” stuff) versus REPORTED EARNINGS which is what all historical valuations are based. I have also included revenue growth, as well.
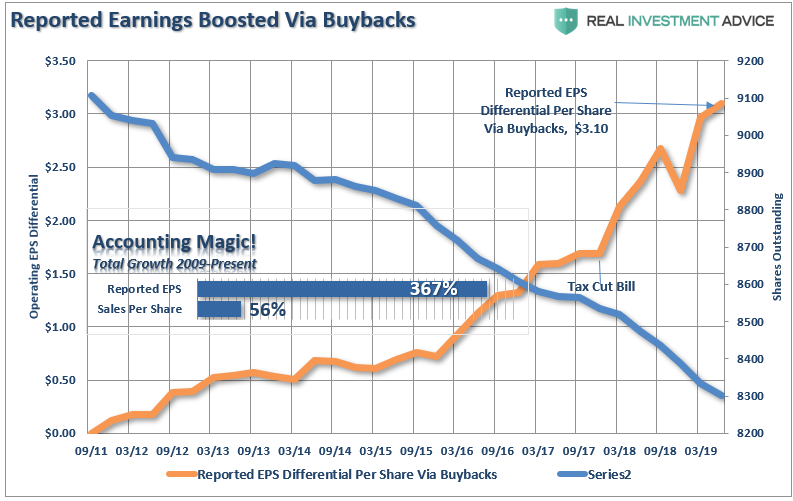
This is not a new anomaly, but one which has been a consistent “meme” since the end of the financial crisis. As the chart below shows, while earnings per share have risen by over 360% since the beginning of 2009; revenue growth has barely eclipsed 50%.
While suppressed wage growth, layoffs, cost-cutting, productivity increases, accounting gimmickry, and stock buybacks have been the primary factors in surging profitability, these actions have little effect on revenue growth. The problem for investors is all of the gimmicks to win the “beat the estimate game” are finite in nature. Eventually, real rates of revenue growth will matter. However, since suppressed wages and interest rates have cannibalized consumer incomes – there is nowhere left to generate further sales gains from in excess of population growth.
Left Behind
While Wall Street has significantly benefited from the Fed’s interventions, Main Street has not. Over the past few years, as asset prices surged higher, there has been very little translation into actual economic prosperity for a large majority of Americans. This is reflective of weak wage, economic, and inflationary growth which has led to a surge in consumer debt to record levels.
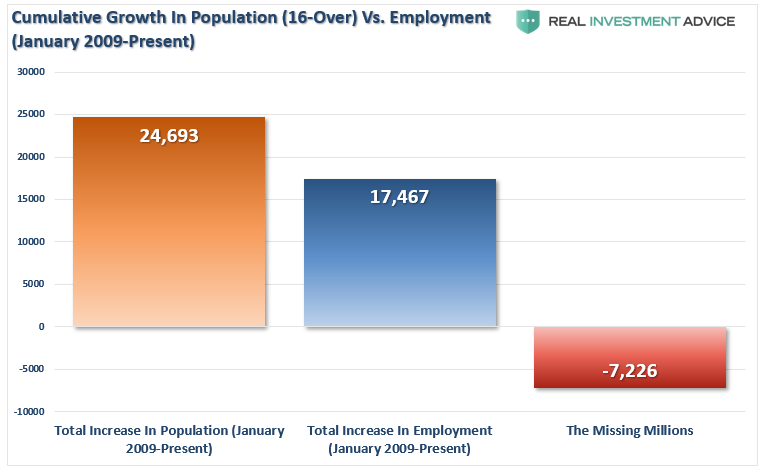
Of course, weak economic growth has led to employment growth that is primarily a function of population growth. As I addressed just recently:
“Employment should increase to accommodate for the increased demand from more participants in the economy. Either that or companies resort to automation, off-shoring, etc. to increase rates of production without increases in labor costs. The chart below shows the total increase in employment versus the growth of the working-age population.”
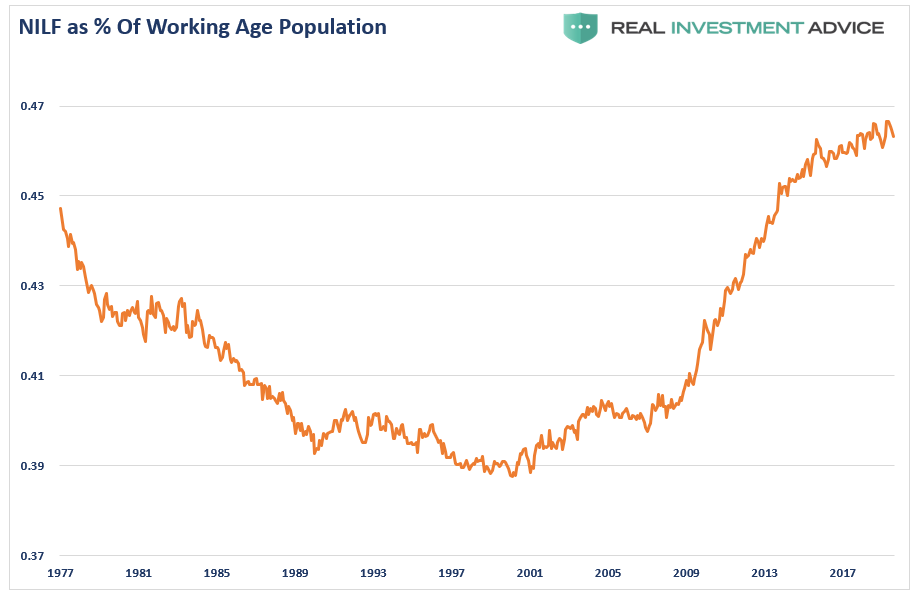
While reported unemployment is hitting historically low levels, there is a swelling mass of uncounted individuals that have either given up looking for work or are working multiple part-time jobs. This can be seen below which shows those “not in labor force,” as a percent of the working-age population, skyrocketing.
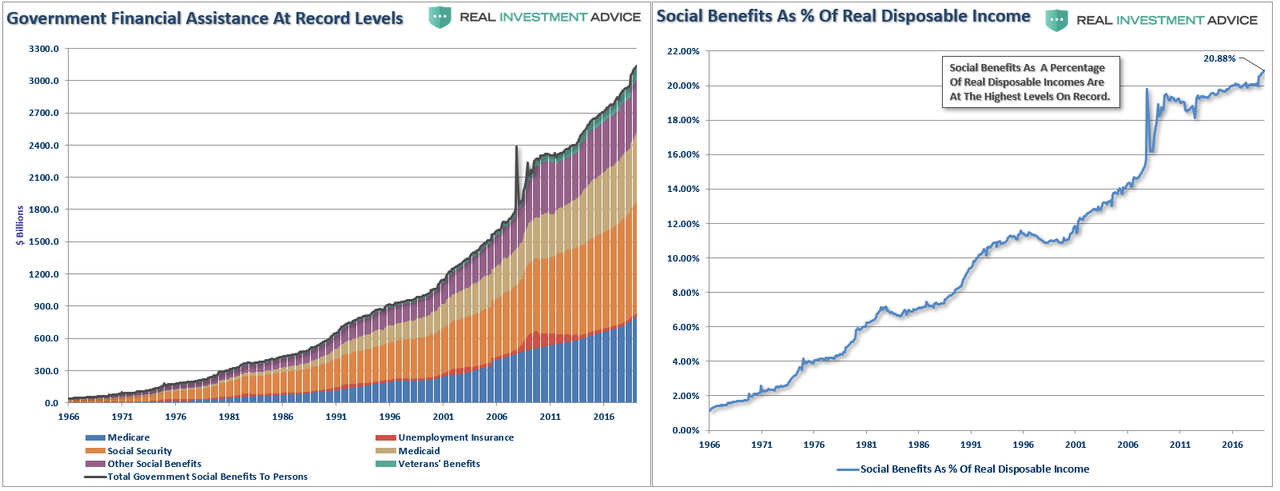
If employment was indeed as strong as reported by government agencies, then social benefits would not be comprising a record high of 22% of real disposable incomes.
Without government largesse, many individuals would literally be living on the street. The chart above shows all the government “welfare” programs and current levels to date. While unemployment insurance has hit record lows following the financial crisis, social security, Medicaid, Veterans’ benefits and other social benefits have continued to rise and have surged sharply over the last few months.
With 1/5 of incomes dependent on government transfers, it is not surprising that the economy continues to struggle as recycled tax dollars used for consumption purposes have virtually no impact on the overall economy.
Conclusion
While financial markets have surged to “all-time highs,” the majority of Americans who have little, or no, vested interest in the financial markets have a markedly different view. While the Fed keeps promising with each passing year the economy will come roaring back to life, the reality has been that all the stimulus and financial support hasn’t been able to put the broken financial transmission system back together again.
Amazingly, more than two-years following the initial writing of this article, the gap between the markets and the economy has grown even wider. Eventually, the current disconnect between the economy and the markets will merge.
I bet such a convergence will likely not be a pleasant one.
No comments:
Post a Comment
Note: Only a member of this blog may post a comment.