From what’s priced in to curve inversion to term premium. Here are the 5 things every trader needs to know about the rates market…
5. What’s Priced In
-50bps is now the base case for September.
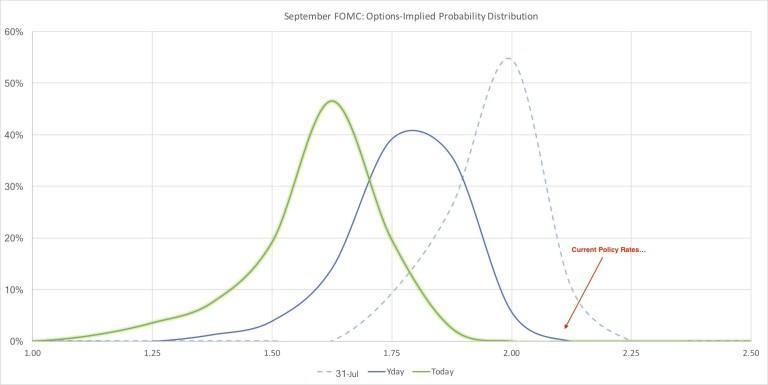
Here are the probabilities that the options market is assigning to the September FOMC, currently.
- No change: 2.5%
- -25bps: 19.7%
- -50bps: 65.6%
- -75bps or more: 12.2%
One brief note on methodology: the CME “FedTool” has a similar probability tree but it calculates the odds using binary Markov chains. In a nutshell, this means that they only allow for 1 of 2 outcomes to be altered at a given meeting. If you think the Fed could either stay on hold, cut by 25, cut by 50, or more (which the options market is telling us is a possibility – why else would somebody be wanting to pay anything at all for something like the EDU9 98.50 calls?), then a binary chained decision tree isn’t correct. Look closely at the CME tool, they show zero probability for an “on hold” result. Even in this cynical world of second guessing policymakers, we should know that can’t be correct with more than a month still to go…
4. Curve Inversion
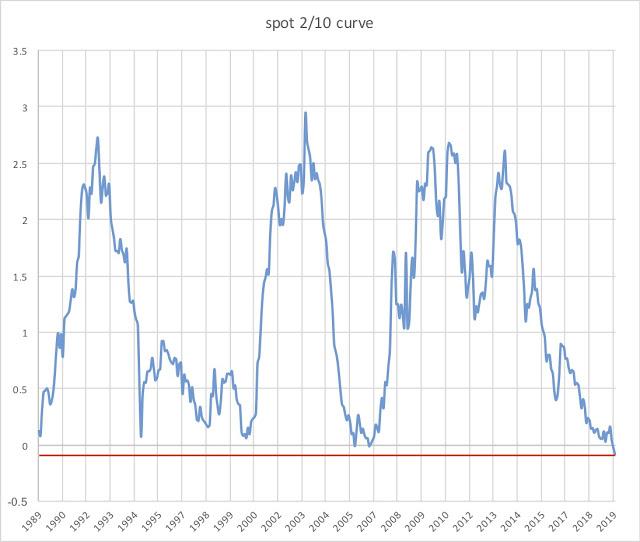
Read any sell-side literature & you’ll quickly find that the shape of the curve is one of the most widely followed “recession predictors” available, where a flat curve indicates a higher likelihood of recession. When this flattening becomes so pronounced that the yield on the longer tenor falls below the yield on the shorter tenor, it’s referred to as inversion – something that’s happened only a handful of times. We’re now sitting at the most inverted levels in the last 30 years for the spot 2s/10s swaps curve. But, caution against extrapolating that into the meaningful “recession predictor” that the street seems to love.
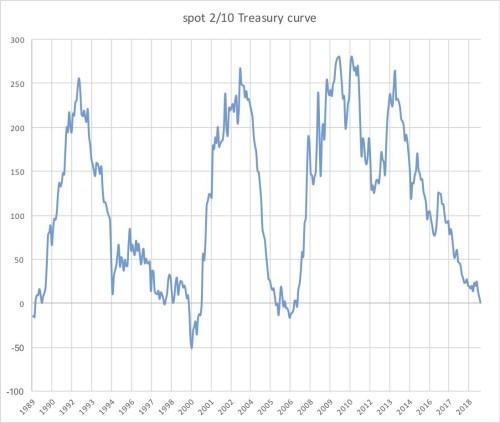
Here’s the same curve, but in Treasury space (not swaps). This is the curve that you’ll hear pundits hyperventilating over whenever it dips below 0 (which it did, ever so briefly, this morning).
There is a difficult causality to unravel here, but the bottom line is that – while over very long term horizons, it may seem causal to NBER-defined “recessions” – there’s no clear linkage. Here’s the last 21 times the curve has seen a weekly close that caused 2s/10s to go from positive to inverted – along with the SPX return over the following month. There’s really nothing here.
3. Funding
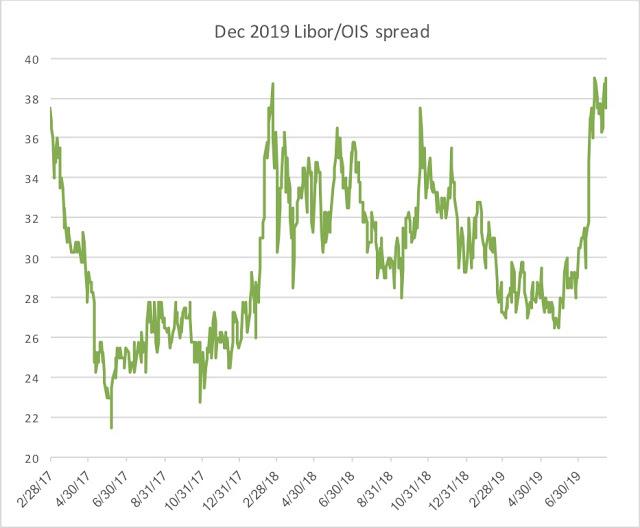
One of the aspects of the financial crisis that was so devastating to the credit market was the fact that funding spreads experienced a seizure unlike anything they’d seen previously. Steps were taken in the aftermath to buttress the industry against this happening again, but we still see periodic flare-ups in funding markets that often precede meaningful volatility in other asset classes. The most popular measure of this to follow is the spread between bank borrowing rates (representing unsecured credit) & the overnight Fed rate (representing secured credit): LIBOR vs OIS, also referred to as FRA/OIS (FRA = forward rate agreement). When this spread widens, it indicates funding stress is present. The Dec 19 future associated with this spread is now at its widest levels since early February 2018.
We all know what happened after that to volatility in other asset classes.
2. Positioning
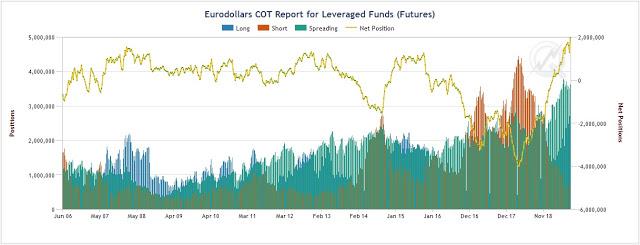
Hedge funds are more long the front-end of the interest rates market right now than at any historical point on record. Yes, rates are low – and the largest positions in the hedge fund community are setup to profit if they go even lower (yellow line shows net position).
1. Negative Rates
Negative Rates are to 2019 what Beanie Babies were to the 90s. They might be great for price appreciation during times like these, but if you’re expecting them to return your love in the way, say, a “positive” yielding investment will – you’re sadly mistaken.
That all being said. Consider this for a moment. The 0% coupon German 10yr note currently yields about negative 0.70%. It hasn’t yielded more than positive 1% since 2014. But if you’d invested a million dollars in German 10yr bonds 6 months ago, you’d have made more in 6 months than you would make in interest on the US 10yr Treasury – from now until 2025.
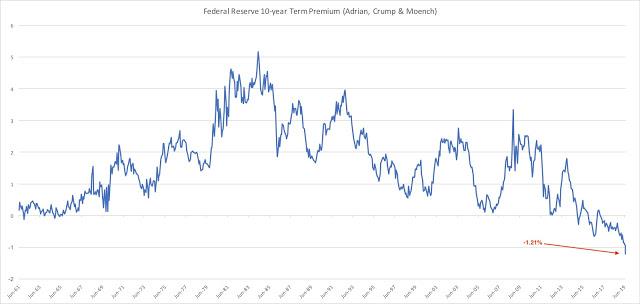
The Federal Reserve tracks what’s called “Term Premium”. The best way to understand this is as a measure of what compensation you’re receiving (once you strip out all the effects of inflation & some other econometric factors) for owning Treasuries. This seems like a sensible measure to watch: if you’re getting 1.625% in interest for 10-year bonds, but the inflation rate is the same – then it’s not really all that much compensation you’re earning in the end.
Currently, we’re at -1.21%. That’s easily the lowest since the Fed started tracking this in 1960.

No comments:
Post a Comment
Note: Only a member of this blog may post a comment.