Americans are infamous for their eagerness to spend money they don’t have. A whole industry has grown up around making that happen, from payday lenders to the government that guarantees or insures a large portion of the mortgages so that lenders and investors don’t have to carry the risk. Consumer debt is turned into asset-backed securities, from government-guaranteed mortgage-backed securities to subprime-auto-loan-backed securities whose top tranches carry an AA-rating or even a AAA-rating.
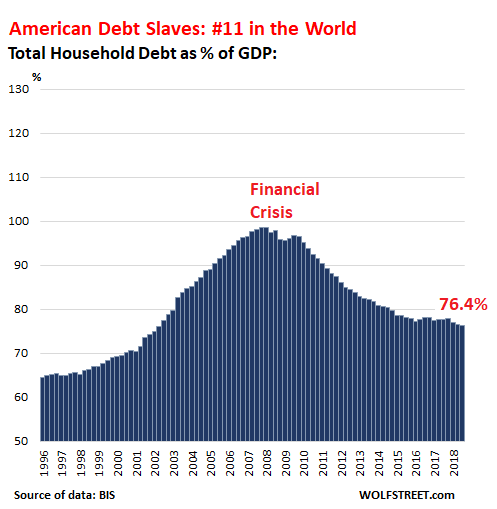
It all worked out. But then came the moment when Americans deleveraged, mostly by defaulting on their debts, particularly their mortgage debts, which triggered the US Financial Crisis and then the Global Financial Crisis. The world should have learned a lesson, but no. Who has learned a lesson? American consumers whose household debt in relationship to US GDP has continued to decline.
US household debt inched down to 76.4% of GDP in the third quarter 2018, according to the newest batch of global data from the Bank for International Settlements. This was the lowest level since 2002. It put Americans in the inexplicably wimpy, and for the finance sector, insufferable 11th place:
Even at the peak just before the Financial Crisis, American household debt never quite reached 100% of GDP. This is important as we move on to the winners on this list.
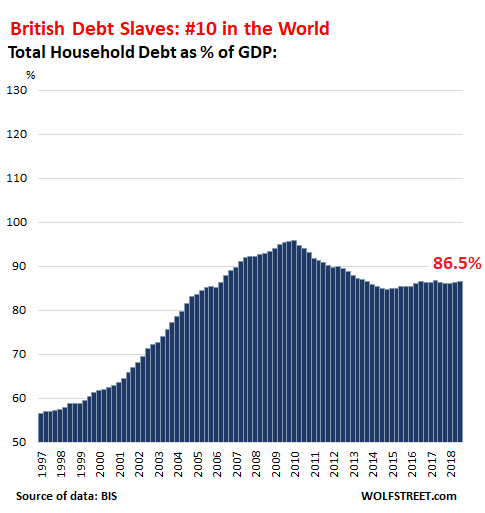
UK households also deleveraged after the Financial Crisis, with the UK banking system kept upright only by massive bailouts and the nationalization of some banks. But recently, household debt as percent of GDP has been ticking up, reaching 86.5%, which put the UK into 10th place:
This ratio is a function of two factors: Household debt measured in local currency and the size of the economy measured by nominal local-currency GDP. This ratio cancels out inflation. When household debt grows more slowly than nominal GDP, the ratio declines. When household debt grows faster than GDP, the ratio increases, and consumers are becoming an ever-riskier part of the financial system.
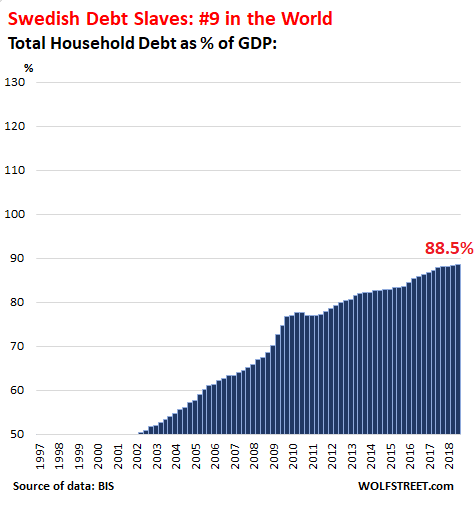
Then there is Sweden. Swedish households used to be notoriously debt-averse, like German households, and their household-debt-to-GDP ratio remained below 50% until 2001. But then someone figured out how to fix that, and suddenly, Swedes went on a phenomenal borrowing binge, and the household-debt-to-GDP ratio nearly doubled over those years to 88.5%, earning them the 9th place in the debt-slave competition:
On this list of winners, the charts are on the same scale, and that’s why there is so much white space above American, British, and Swedish consumers. Consumers that did not do their job in the early part of this century and did not borrow enough fell off the chart entirely, which is a fate that afflicted the Swedes until 2002.
Germans, with a household-debt-to-GDP ratio of merely 52.7%, still, after all these years, would barely register on the bottom of this chart. And Austrians with a ratio of 48.7% wouldn’t even be on the chart. On the other hand, the white space in the charts gets filled in by the winners on this list.
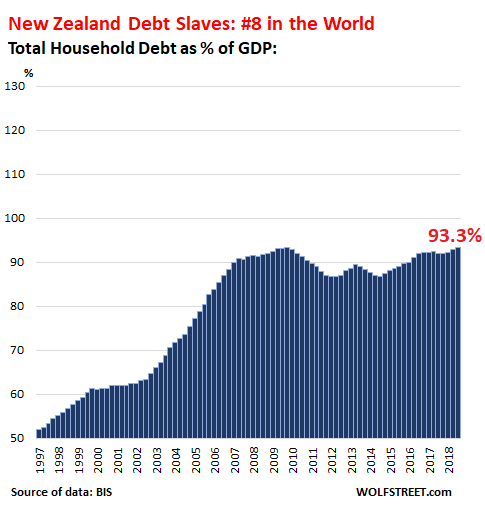
New Zealand, with a household-debt-to-GDP ratio of 93.3% and in eighth place, has been helped along by a property bubble that has been inflating mortgage debts:
Economists love debt slaves.
Household borrowing converts mostly into household spending, which is the biggest contributor to GDP. So economists adore growing household debt because it means growing GDP, and the economic system moves heaven and earth to get consumers to borrow more so that they buy more and add to GDP. And these households become enslaved to their debts and their financiers.
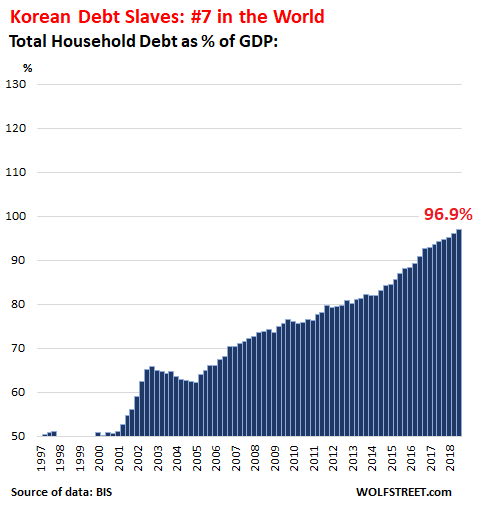
Korean households have made amazing progress becoming debt slaves, now closing in on the glorious 100% line, with household-debt-to-GDP at 96.9%. At the current pace, a couple more years, and they’ll have arrived!
When household borrowing outruns GDP growth for long enough and reaches certain levels, things can get iffy, as US household debt has shown with its starring role in the Financial Crisis though it never even exceeded 100% of GDP. So below are all the countries whose household-debt-to-GDP ratio now exceeds 100%.
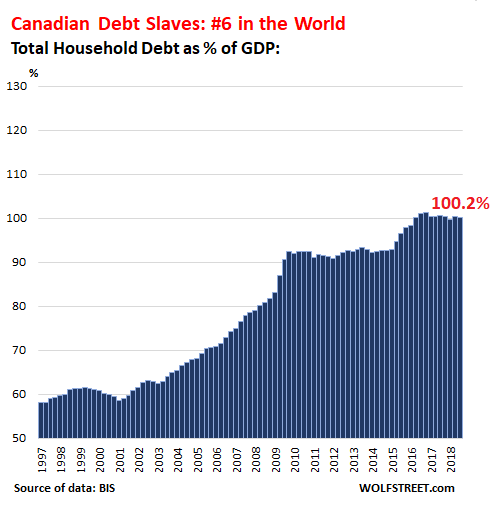
Canadian households have long been making headlines with their top-notch borrowing binge to support their top-notch housing bubble. By other debt measures, such as debt-to-disposable income, Canadian and Australian households have been battling over first place for years. In the debt-to-GDP measure, Canadian households are in a still respectable 6th place: This debt will pose some issues as the majestic housing bubbles in top metros are now deflating:
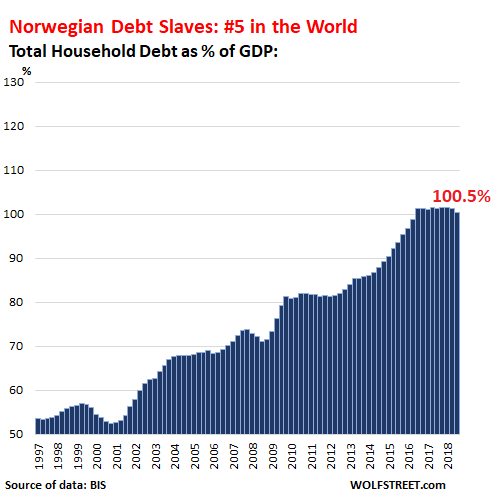
Norwegian households have bravely taken their household-debt-to-GDP ratio from 81% in 2012 to 101% in 2016. But this has since hit a ceiling as even regulators began to fret about the steep ascent, and a down-tick has been observed in the third quarter:
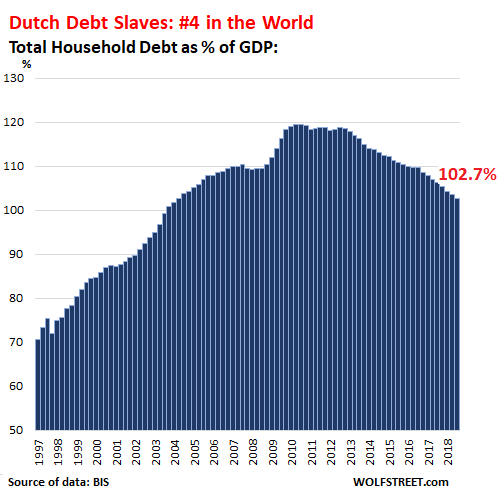
Households in the Netherlands were track to be undisputed king of the hill, with a debt-to-GDP ratio nearing 120%, in part because GDP plunged during the Financial Crisis, which caused the spike in the debt-to-GDP ratio and the collapse of some banks. During the subsequent euro debt crisis, GDP declined again. But since then, the economy has grown, and households have curtailed their borrowing, edging away from the brink, and in the process getting demoted to 4th place:
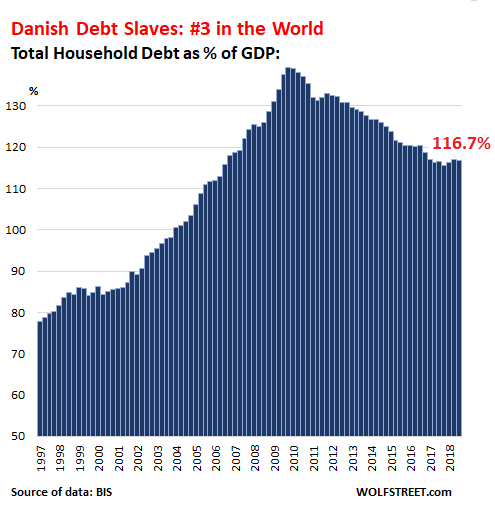
Households in Denmark exploded their debt-to-GDP ratio from an already high 90% in 2003 to nearly 140% during the euro debt crisis as the country went through a blistering recession. GDP still hasn’t recovered to the level before the debt crisis, as households are maxed out and have been whittling down their debts, but at 116.7% of GDP, the household-debt-to-GDP ratio lands them on 3rd place on the list of the biggest debt slaves in the world:
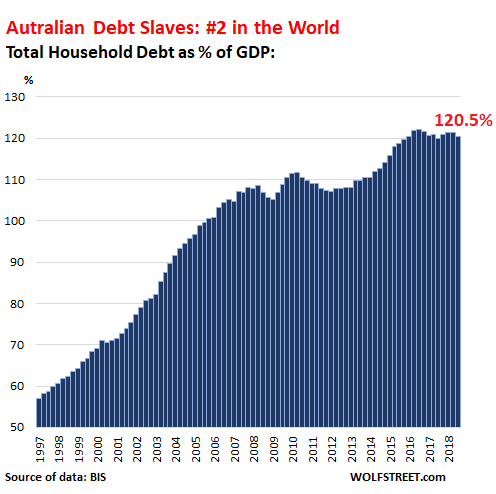
Australian households have been caught up in one of the biggest housing bubbles in the world, financed by debt. The household-debt-to-GDP ratio more than doubled between 1997 and 2016. Now that the housing bubble is deflating at an astounding pace, the debt ratio has begun to tick down, but remains in second place:
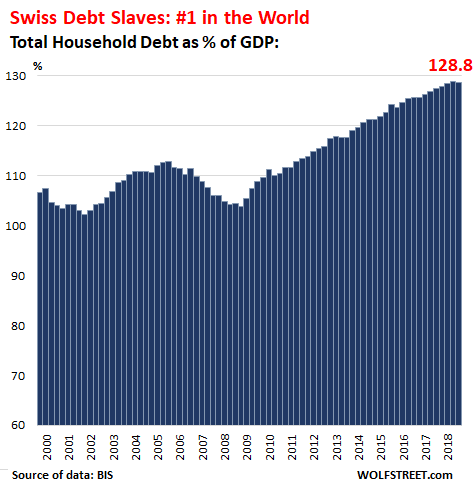
And the #1 debt slaves in the world: Swiss households. This is one of the reasons interest-rate repression remains the rule in Switzerland. The Swiss National Bank has imposed its negative interest rate policy on the country for years, and there have been stories of mortgages with 0% and even negative interest rates. There is simply too much household debt, and no one wants to see it blow up. Hence the negative interest rate policy. But this policy encourages more household borrowing, and the cycle will continue until it can’t:
The most explosive household debt: China
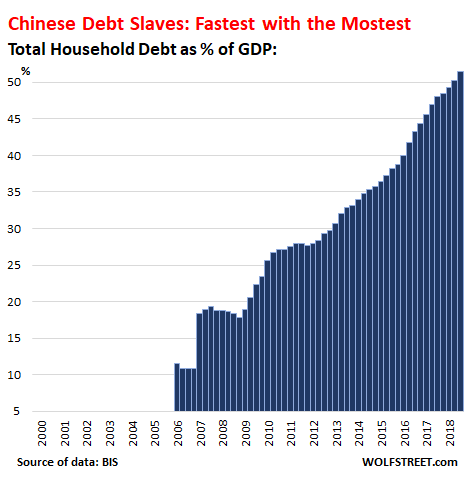
China is in a category of its own. And so the chart has a different scale. The household-debt-to-GDP ratio is still in the German neighborhood of just above 50%, but it has quintupled in the 12 years since the BIS data began in 2006. The idea that Chinese households are paying cash to sustain their housing bubble or to buy cars has become a bad joke: Chinese consumers have discovered debt, and they are eagerly turning into debt slaves:
No comments:
Post a Comment
Note: Only a member of this blog may post a comment.