About Me

My photo
An Investor and counsellor in Financial Market

Friday, May 29, 2020

How big oil is trying to win back investors

Supermajors claim their prospects are not as bleak as they seem
The annual shareholder meetings of ExxonMobil, Chevron and bp, all held on May 27th, each resembled a yearly check-up in a burning clinic. Covid-19 has caused the deepest collapse of demand for the oil giants’ products in history. In April Royal Dutch Shell, an Anglo-Dutch firm, cut its dividend for the first time since the second world war. On May 1st ExxonMobil reported its first loss since the mega-merger that formed the group in 1999.
Even before the pandemic investors were searching elsewhere for lower risk and higher returns. Energy was the worst-performing sector in the s&p 500 index in four of the past six years. Yet the supermajors argue that, for all that, their prospects aren’t bad.
They have half a point. Many of them have become more resilient since the last downturn, in 2014, pursuing more profitable projects and cutting costs. The oil price required to cover capital spending and dividends for the seven biggest—ExxonMobil, Shell, Chevron, Total, bp, Equinor and Eni—is about half what it was in 2013, reckons Goldman Sachs, an investment bank (see chart).
More oil firms are also preparing for a low-carbon future. In December Repsol of Spain pledged to reach net-zero emissions from its operations and the sale of its products by 2050. bp, Shell, Eni and Total have since announced their own commitments.
Moreover, as smaller oil firms reel from the virus, particularly in America’s shale basins, bigger ones may scoop up their assets. The supermajors’ spending cuts may slow their oil production. But that is only a problem if you think there is value in production growth, says Michele Della Vegna of Goldman Sachs. If excessive growth is the problem, he says, then cuts could be part of the solution.
There are two hitches. The break-even price for some firms, though lower than it was, remains high. ExxonMobil’s stands at $70, double what oil trades at today. And it is unclear how quickly—or if—supermajors should move away from oil investments. ExxonMobil and Chevron, America’s biggest oil firms, think not. Neither has set a goal for curbing emissions from the sale of their products. On May 27th ExxonMobil’s shareholders voted against splitting the roles of chairman and chief executive. Green investors had hoped an independent chairman might spur change.
European supermajors look like Birkenstocked tree-huggers in comparison. Still, their promises are loose. Italy’s Eni said in February that its oil-and-gas production would plateau by 2025, but left wriggle room for a “flexible decline” for oil thereafter. On May 5th Total vowed to reach net-zero—but only for products sold in Europe. Shareholders will consider a resolution for more expansive goals on May 29th. bp, under pressure from activists, is working to explain how it can meet climate targets.
The firms have a way to go. Norway’s Equinor devoted about 8% of capital spending last year to renewables; Shell’s figure was 2%. Meanwhile, a new type of rival is emerging. At $68bn, the market value of Iberdrola, a Spanish utility that develops solar and wind farms, has overtaken Eni’s and Equinor’s, and is chasing bp’s

Wednesday, May 27, 2020

Why The Gold/Silver Ratio Is A Useful Indicator

There’s a debate in gold bug circles over whether the price difference between gold and silver – the gold/silver ratio – tells us anything useful.
Some skeptics, for instance, view the original gold/silver ratio of 15 - from America’s 18th century bi-metallic system – as just a political number pulled more-or-less out of thin air by Alexander Hamilton and therefore useless today. Others note that gold is a purely monetary metal and silver is part industrial, part monetary, and conclude that it’s apples to oranges - and therefore not an indicator of future prices.
Both points are factually defensible, sort of. But they’re also irrelevant. The real reason the gold/silver ratio has tended to fluctuate within a broad but well-defined range is that humans have a vivid visual imagination.
Here’s how it works:
Early in a precious metals bull market, people are skeptical of the need for safe-haven assets, so the money that flows into the sector goes mostly to the big-name, super-safe choice, which is gold. Gold goes up relative to silver, and the gold/silver ratio expands.
Gold keeps rising and new money – much of it attracted by the metal’s newfound price momentum rather than an understanding of the nature of money – flows in, pushing gold even higher.
The early gold investors register big gains and begin to feel smart and therefore more willing to take on a bit of extra risk in return for potentially even bigger gains. They look around for “the next gold” and find silver, the other monetary metal, languishing at a relatively low price.
Then they start thinking in images. First, they picture a single one-ounce gold coin and consider what it would cost. At gold’s new, higher price, this seems like a lot of money for such a small, though admittedly pretty, thing.
Next, they consider the price of silver and envision how many – also very pretty – one-ounce coins they can buy for the price of a single ounce of gold. And their imagination conjures up something like this:
Suddenly, silver looks extremely cheap. For the price of a single Gold Eagle, one can get two heaping handfuls of shiny, heavy silver ounces.
A bit more consideration reveals that in a SHTF scenario, silver coins are actually more useful than gold because their smaller denominations allow them to function as $20 bills rather than gold’s illiquid $1,000 +. You can buy groceries and bullets with silver coins.
Suddenly aware of silver’s advantages, investors conclude that at current relative prices, the choice is a no-brainer. Silver is the precious metal to load up on.
Adjust this thought process for the global pandemic’s distortion of most  markets and convert it into a chart, and you get the past two months’ gold/silver ratio, which depicts a bout of hair-on-fire panic followed by a trend back towards traditional norms:
So what happens now? Historically, both precious metals keep rising, with silver rising faster than gold until the imagined pile of silver required to buy a single ounce of gold looks something like this:
Then the process shifts into reverse, with a single gold coin looking better in the mind’s eye than a paltry few bits of silver.
We are nowhere near that point, so expect investor imaginations to work in silver’s favor for years to come.

Tuesday, May 26, 2020

Why Didn't The 1958 & 1918 Pandemics Destroy The Economy? Hint: It's The Lockdowns

Media pundits and politicians are now in the habit of claiming it was the pandemic itself that has caused unemployment to skyrocket and economic growth to plummet. The claim is that sick and dying workers, fearful consumers, and disrupted supply chains would cause economic chaos. Some have even claimed that economic shutdowns actually help the economy, because it is claimed allowing the spread of the disease will itself destroy employment and economic growth.
Leaving aside the fact there's no evidence lockdowns actually work, we can nonetheless look to past pandemics - where coercive government interventions were at most sporadic - we should see immense economic damage.  Specifically, we can look to the the pandemic of 1957-58, which was more deadly than the COVID-19 pandemic has been so far. We can also look to the 1918-19 pandemic. Yet, we will see that neither produced economic damage on a scale we now see as a result of the government mandated lockdowns. This thoroughly undermines the claims that the lockdowns are only a minor factor in economic destruction, and that the virus itself is the real culprit.

Economic Reactions in 1957–58, and in 1918–19

The CDC estimates that as of May 18 this year approximately ninety thousand Americans have died of COVID-19. Adjusted for population size, that comes out to a mortality rate of 272 per million.
This is (so far) less than half the mortality rate for the 1957–58 flu pandemic. In that pandemic, it is estimated that as many as 116,000 Americans died. Yet, the US population was much smaller then, totaling only 175 million. Adjusted for population size, mortality as a result of the "Asian flu" pandemic of 1957–58 was more than 660 per million.
That's the equivalent of 220,000 deaths in the United States today.
Yet, Americans in 1957 did not respond by shutting down commerce, forcing people into "lockdown," or driving unemployment up to Depression-era levels. In fact, reports show that Americans took little action beyond the usual measures involved in trying to slow the spread of disease: hand washing, staying home when ill, etc.
Although the virus does appear to have been a factor in the 1958 recession, the economic effects were miniscule compared to what the US now faces from the reaction to the COVID-19 virus. This suggests that most of the economic damage now being experienced by workers and households in the US is more a product of the policy reaction to the virus than to the virus itself.
The pandemic of 1957–58 was a serious and deadly problem for many. As cases of the Asian flu began to spread, it became clear to many scientists and other observers that there was something different and deadly about this flu. Indeed, according to D.A. Henderson, et al in "Public Health and Medical Responses to the 1957–58 Influenza Pandemic, "Humans under 65 possessed no immunity to this H2N2 strain."1 This meant that the "highest attack rates were in school-age children through young adults up to 35 or 40 years of age." Total deaths due to the flu over this period range from 70,000 to 116,000. This is cause for concern, to say the least. With younger Americans, many of them in prime working age, susceptible to the disease, one could anticipate significant costs in terms of economic growth and health.
What was the policy reaction to this? Henderson et al. continue:
The 1957–58 pandemic was such a rapidly spreading disease that it became quickly apparent to U.S. health officials that efforts to stop or slow its spread were futile. Thus, no efforts were made to quarantine individuals or groups, and a deliberate decision was made not to cancel or postpone large meetings such as conferences, church gatherings, or athletic events for the purpose of reducing transmission. No attempt was made to limit travel or to otherwise screen travelers. Emphasis was placed on providing medical care to those who were afflicted and on sustaining the continued functioning of community and health services….there were no reports that major events were canceled or postponed except for high school and college football games, which were often delayed because of the number of players afflicted.
In 1957–58, there was concern over the availability of medical services. But the emphasis then was on increasing medical services rather than state-enforced quarantines and "social distancing" measures. Nor did a vaccine offer an easy way out:
Health officers had hopes that significant supplies of vaccine might become available in due time, and special efforts were made to speed the production of vaccine, but the quantities that became available were too late to affect the impact of the epidemic.
Schools and workplaces were affected by absent students and workers, but absenteeism at schools was a larger factor, with some schools even closed for short periods as a result of so many missing students. Absenteeism did not rise to the level of causing shortages:
Available data on industrial absenteeism indicate that the rates were low and that there was no interruption of essential services or production. The overall impact on GDP was negligible and likely within the range of normal economic variation.
Overall, the economy declined by approximately 2 percent during both the first and second quarter of 1958, but this could not all be attributed to the effects of the virus. Unemployment at the time also surged, peaking at 7.5 percent during July 1958. Economic growth was positive again, however, by the fourth quarter of 1958 and had soared to over 9 percent growth in 1959. Unemployment had fallen to 5 percent by June of 1959.
But the overall economic impact of the virus itself was hardly disastrous. Henderson, et al conclude:
Despite the large numbers of cases, the 1957 outbreak did not appear to have a significant impact on the U.S. economy. For example, a Congressional Budget Office estimate found that a pandemic the scale of which occurred in 1957 would reduce real GDP by approximately 1% ‘‘but probably would not cause a recession and might not be distinguishable from the normal variation in economic activity.’’
The 1918–19 pandemic, which caused an astounding ten times as many deaths per million as the 1957–58 pandemic, also failed to produce economic disaster. Although the US entered the 1918–19 pandemic in poor economic shape thanks to the Great War, according to economists Efraim Benmelech and Carola Frydman,
The Spanish flu left almost no discernible mark on the aggregate US economy….According to some estimates, real gross national product actually grew in 1919, albeit by a modest 1% (Romer 1988). In new work, Velde (2020) shows that most indicators of aggregate economic activity suffered modestly, and those that did decline more significantly right after the influenza outbreak, like industrial output, recovered within months.
Nor can the pandemic be blamed for the 1921 recession, because "by then the decline in output had all to do with a collapse in commodity prices when post-war European production finally recovered."

How Do Pandemics Affect Economic Growth?

Not surprisingly, then, we find relatively mild estimates in a 2009 World Bank report estimating the economic consequences of new pandemics. The authors concluded that moderate and severe pandemics would lead to GDP declines of 2–5 percent. Or, as a 2009 Reuters report summarized it:
If we get hit with something like the 1957 Asian flu, say goodbye to 2 percent of GDP. Something as bad as the 1918–19 Spanish flu would cut the world’s economic output by 4.8 percent and cost more than $3 trillion.
Not even a 1918-sized pandemic was expected to produce the sort of economic carnage we now see from COVID-19.

The Reaction in 2020

Needless to say, the economy today appears to be in far worse shape in the wake of the 2020 pandemic than in the days following the 1957–58 outbreak, or even in 1919.
As of April 2020, the unemployment rate has ballooned to 14.4 percent, the highest rate recorded since the Great Depression. The Atlanta Federal Reserve, meanwhile, forecasts a drop in GDP of more than 40 percent. More mild estimates suggest drops of 8 to 15 percent. If the milder predictions prove true, then the current downtown is "only" the worst since the Great Depression. If the Atlanta Fed is right, then we're in an unprecedented economic disaster.
The World Bank's estimates of even a "severe" pandemic, which predicted a GDP drop of around 5 percent, don't even come close to the estimates for the 2020 collapse. And why should they? The World Bank report didn't anticipate the global economic shutdown imposed on billions of human beings by the world's regimes. Thus, the bank's estimates assumed that economic losses would be limited to absenteeism, disrupted trade and travel, and declining demand due directly to disease or fear of disease.
So why the enormous difference in economic effects? The answer almost certainly lies in the fact that governments in 2020—unlike in any other period in American history—engaged in widespread business closures, "stay-at-home" orders, and other state-mandated and state-enforced actions that led to widespread layoffs and plummeting economic output.
Defenders of government-coerced "lockdowns" have insisted that fear of the virus would have destroyed the economy even without lockdowns, but there is no historical precedent for this claim, and no current evidence to support it. Although some survey data has been proffered to suggest that more than 60 percent of Americans say they plan to comply with stay-at-home orders, this merely tells us how people make plans when threatened with fines, police harassment, and other coercive measures.
In reality, the experience of the 1957–58 pandemic—or even the 1918–19 pandemic—gives us no reason to believe that joblessness should be increasing at unprecedented rates and that GDP would collapse by catastrophic levels. In a modern industrialized economy, that sort of economic damage is only achievable through government intervention, such as socialist coups, wars, and forced economic shutdowns in the name of combating disease.
The cost in terms of human life will be significant. One study contends that the current economic downturn could lead to seventy-five thousand "deaths of despair." This is not shocking, however, since the fatal effects of unemployment and economic decline have been known for decades.
Defenders of lockdowns will likely continue to claim that "we have no choice" but to continue lockdowns for long periods of time. At the very least, many claim that the lockdowns until now have been "worth it." Yet the efficacy of lockdowns remains an open question, and has hardly been proven. Meanwhile, the world faces the worst economic disaster experienced in centuries. It didn't have to be this way.

Wednesday, May 20, 2020

Creative destruction in times of covid


Is now the time for entrepreneurial true grit?
 
A struggling Airbnb was still called AirBed&Breakfast when its founders decided to bet its future on the Democratic National Committee in Denver in 2008. Their air-bed idea was not popular with the 80,000 people congregated to select a presidential candidate. So they focused on breakfast instead, peddling $40 boxes of cereals called Obama O’s and Cap’n McCain’s (their quip: “Be a cereal entrepreneur”). The timing was as bad as the pun. The event came just weeks before Lehman Brothers collapsed at the height of the financial crisis of 2007-09. Yet shortly afterwards they obtained their first-ever funding. The angel investor who backed them dubbed them “cockroaches” for their survival skills. That may not be the most tasteful way to describe people in the hospitality trade. The founders, though, considered it the best compliment they had ever received
Like Airbnb, some of the best-known names in business started during steep slumps, including Uber (2009), Microsoft (1975), Disney (1923), General Motors (1908) and General Electric (1890). Disruptive products and services, too, have emerged in times of crisis, notably Apple’s iPod as the dotcom bubble burst in 2000 and Alibaba’s Taobao, an online-shopping mall, during China’s sars epidemic of 2003.
Such stories loom large in startup folklore as evidence of entrepreneurial true grit. Yet they are rarities. Our calculations indicate that among almost 500 of today’s biggest listed firms in America, whose origins date as far back as 1857, a much larger number started life in expansionary years than during recessions. Of those founded since 1970, more than four-fifths were born in good times (see chart). That, of course, overlooks innumerable firms created along the way that have either not made it to the top, or fallen by the roadside. But it suggests that however hard it is for the enterprising to build a lasting business, it is even harder for those who start off with the economic winds blowing in their faces.
Save for a few industries such as health care, it is safe to assume that investment in innovation will plummet during the covid-19 pandemic. It usually does in times of crisis. Venture capital (vc) will also dry up as everyone keeps their heads down and tries to preserve cash. In 2007-09, vc funding in America fell by almost 30%. Yet this column would not be named after Joseph Schumpeter, the father of creative destruction, if it did not believe that following a slump, a burst of entrepreneurial activity will eventually emerge. As he wrote in “The Theory of Economic Development”, published in 1911 (itself a recessionary year), “the very logic of the capitalist system [is that] after some time of depression, new entrepreneurs would emerge. And then there would be a new ‘swarm’ of entrepreneurs. A wave of prosperity would start up and the whole cycle would roll on.” Assuming this remains the case, will the protagonists be tiny startups coming out of nowhere? Will they be better-funded entrepreneurs who have long prepared for such a moment? Or will they be the titans of tech?
With the world in upheaval, enterprising minds are already whirring. Some of them are altruistic: schoolchildren, for instance, have been 3d-printing plastic visors for front-line workers. Some of them are saucy, such as the Thai bodybuilders, put out of work by lockdown, who last month set up Bsamfruit Durian Delivery, promoting it on Facebook not only with photos of durians and mangoes, but of taut abs and bulging bosoms. Some of them will simply be hungry for fame and fortune, believing, like Michael Moritz of Sequoia Capital, a vc firm, that social changes accelerated by the crisis, such as food delivery, telemedicine and online education, will eventually generate lucrative business opportunities. They will also expect the economic slump to wipe out incumbents, muting competition and freeing up space and manpower—provided governments do not interfere with the inevitable by propping up zombie firms.
But even with the best ideas in the world, first-time entrepreneurs will struggle to convince investors to give them capital in the depths of the crisis, not least if they can only pitch to them over Zoom. Instead, the more likely standard-bearers of creative destruction will be existing firms, albeit small ones, which raised enough money before the crisis to survive it and will maintain their flair for innovation throughout, says Daniele Archibugi of Birkbeck, University of London. There may be plenty of such firms. According to Crunchbase, a data gatherer, startups raised about $600bn worldwide in 2018 and 2019. That provides a cushion of support. They will, however, have to be quick at shifting from growth to survival and back again, and at embracing new business plans if their old ones are no longer viable.

Betting on an accumulator

Yet it is not just small, scrappy firms that push innovation forward. Big firms have a critical role to play, too. Alongside creative destruction in times of crisis, Schumpetarian academics point to “creative accumulation” in economic upswings, when incremental innovation is carried out in the research-and-development labs of giant firms. In Europe during the global financial crisis such corporations increased investment into new products and ideas, as did the most innovative small firms. The cash-rich tech giants, such as Microsoft, Amazon, Apple and Alphabet, have become examples of creative accumulation, helping foster innovation during the good times. They will probably continue to do so during the crisis. As they expand into health care, fintech and other industries, they could even be part of a new wave of creative destruction.
That is the optimist’s scenario. A more pessimistic one is that big tech will use its moneybags and muscle to stifle competition, by buying or scaring off more enterprising rivals. What is in little doubt, though, is that the covid-19 crisis, which has turned so many people’s lives upside down, will eventually produce a wealth of new business opportunities. If it attracts swarms of entrepreneurs crawling over cosy oligopolies so much the better. But even if the tech titans prevail for now, they will inevitably find themselves victims of the forces of change. Schumpeter’s “perennial gale of creative destruction” will one day blow them away, too.

Tuesday, May 19, 2020

The Next Perovskite Solar Breakthrough Could Give Us Endless Energy By 2025

Harnessing the motherlode of the sun’s power is almost within our reach. 
The sun, our primary source of energy, bathes our Blue Planet in more solar energy than we can ever hope to reasonably use. Each hour, the sun sends 430 quintillion Joules of energy our way, more than the 410 quintillion Joules that humans consume in a whole year. With the sun likely to be around for another five billion years or so, we have a virtually unlimited source of energy--if only we could tap it efficiently. 
Unfortunately, we are currently only able to harness a minuscule amount of this energy due to technical limitations.
But that could be about change, thanks to advances in one wonder-crystal--perovskite.
The U.S. Department of Energy’s (DOE’s) National Renewable Energy Laboratory (NREL) has forged a public-private consortium dubbed the US-MAP for US Manufacturing of Advanced Perovskites Consortium, that aims to fast track the development of low-cost perovskite solar cells for the global marketplace.
Silicon Panels
According to the IEA, solar power supplied just 592GW, or a mere 2.2%, of the world’s 26,571GW in electricity consumption in 2018. That was after an impressive 20% growth in global PV installations to the tune of nearly 100GW.
More than 90% of those photovoltaic (PV) panels installed were constructed from crystallized silicon. 
Silicon panels have their advantages: They’re quite robust and relatively easy to install. Thanks to advances in manufacturing methods, they’ve become quite cheap over the past decade, particularly the polycrystalline panels constructed in Chinese factories.
However, they have one major drawback: Silicon PV panels are quite inefficient, with the most affordable models managing only 7%-16% energy efficiency depending on factors like placement, orientation, and weather conditions. Si panels are wafer-based rather than thin-film, which makes them sturdier and durable, but the trade-off is a sacrifice of efficiency.  
To meet the world’s rapidly growing energy appetite--and achieve the kind of de-carbonization goals that would help slow the impact of climate change--it would take hundreds of years to build and install enough silicon PV panels. 
This is way too slow, given that we have a mere 10-year window to act to avert irreversible and catastrophic climate change.
More critically, the best (and most expensive) silicon panels to-date boast an efficiency rating maximum efficiency rating of 26.7%, pretty close to the theoretical maximum of 29.1%.


For years, scientists have experimented with alternative crystal formations that would allow panels of similar size to capture more energy. Until now, few designs emerged that were commercially viable, particularly thin-film cells that could theoretically achieve much higher levels of efficiency.
Thin-film PV panels can absorb more light, and thus produce more energy. These panels can be manufactured cheaply and quickly, meeting more energy demand in less time. There are a few different types of thin-film out there, all of them a little different from standard crystalline silicon (c-si) PV panels. 
Amorphous silicon (a-Si) panels are the oldest form of thin-film: a chemical vapor deposits a thin layer of silicon onto glass or plastic, producing a low weight panel that isn’t very energy efficient, managing 13.6%. Then there are cadmium telluride (CdTe) panels, which uses the cadmium particle on glass to produce a high-efficiency panel. 
The drawback there is the metal cadmium, which is toxic and difficult to produce in large quantities. 
These panels are usually produced using evaporation technology: the particles are superheated and the vapor is sprayed onto a hard surface, such as glass. They are thin, but not as dependable or durable as c-si panels, which currently dominate the market.
NREL Perovskite Breakthrough
Perovskite has now managed to break the efficiency glass ceiling.
Perovskites are a family of crystals named after Russian geologist Leo Perovski, “perovskites.” They share a set of characteristics that make them potential building blocks for solar cells: high superconductivity, magnetoresistance, and ferroelectricity. Perovskite thin-film PV panels can absorb light from a wider variety of wave-lengths, producing more electricity from the same solar intensity.
In 2012, scientists finally succeeded in manufacturing thin-film perovskite solar cells, which achieved efficiencies over 10%. But since then, efficiencies in new perovskite cell designs have skyrocketed: recent models can achieve 20%, all from a thin-film cell that is (in theory) much easier and cheaper to manufacture than a thick-film silicon panel.
At Oxford University, researchers reached 25% efficiency; a German research team has achieved 21.6%, while a new record was set in December 2018, when an Oxford lab reached 28% efficiency.
The National Renewable Energy Laboratory NREL has been able to build composite Silicon-Perovskite cell by putting perovskites atop a silicon solar cell to create a multijunction solar cell, with the new cell boasting an efficiency of 27% compared to just 21% when only silicon is used. 
But perhaps more significant is that the organization has been able to boost the longevity of Perovskite solar cells by altering their chemical composition to overcome light-induced phase-segregation-- a process through which the alloys that make up the solar cells break down when exposed to continuous light. 
Low-Cost Perovskite Panels
Solar power has become more affordable, accessible, and prevalent than ever before thanks to technology improvements, competitive procurement, and a large base of experienced, internationally active project developers.
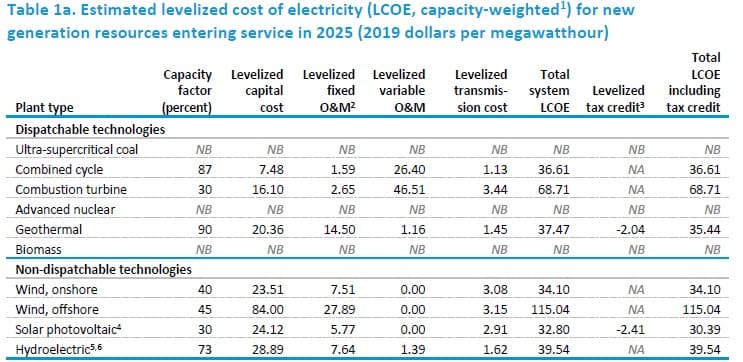
According to the International Renewable Energy Agency (IRENA), solar power generation is now fully competitive with fossil fuel power plants, with the global weighted average levelized cost of electricity (LCOE) for utility-scale solar PV cells having declined 75% to below USD 0.10/kWh since 2010.
Source: IRENA
However, there’s still work to be done.
At an LCOE of $0.085/kWh for photovoltaic cells and $0.185/kWh for concentrating solar projects, solar power(utility-scale + residential rooftop) remains more expensive than other renewable sources including hydro, onshore wind, geothermal and bioenergy.
US-MAP plans to solve issues mainly regarding manufacturing and durability and also tackle sustainability issues mainly relating the use of lead and other metals. The consortium will focus on funding from federal sources and also explore private-sector financing.
Hopefully, it will be able to make this IEA prediction a reality by making solar power one of the cheapest, if not the cheapest, ways to generate electricity by 2025.
The capacity-weighted average is the average levelized cost per technology, weighted by the new capacity coming online in each region. The capacity additions for each region are based on additions from 2023 to 2025. Technologies for which capacity additions are not expected do not have a capacity-weighted average and are marked as NB, or not built.