About Me

My photo
An Investor and counsellor in Financial Market

Monday, November 30, 2015

Oil prices and the Syrian civil war- By Steve Austin.

Most watch in disbelief as hordes of Middle Eastern migrants enter Europe with little to no resistance from border control. Whereas refugees are normally women and children, these migrants are for the most part young males of fighting age leaving a war zone. That prompts concerns on their true motives.
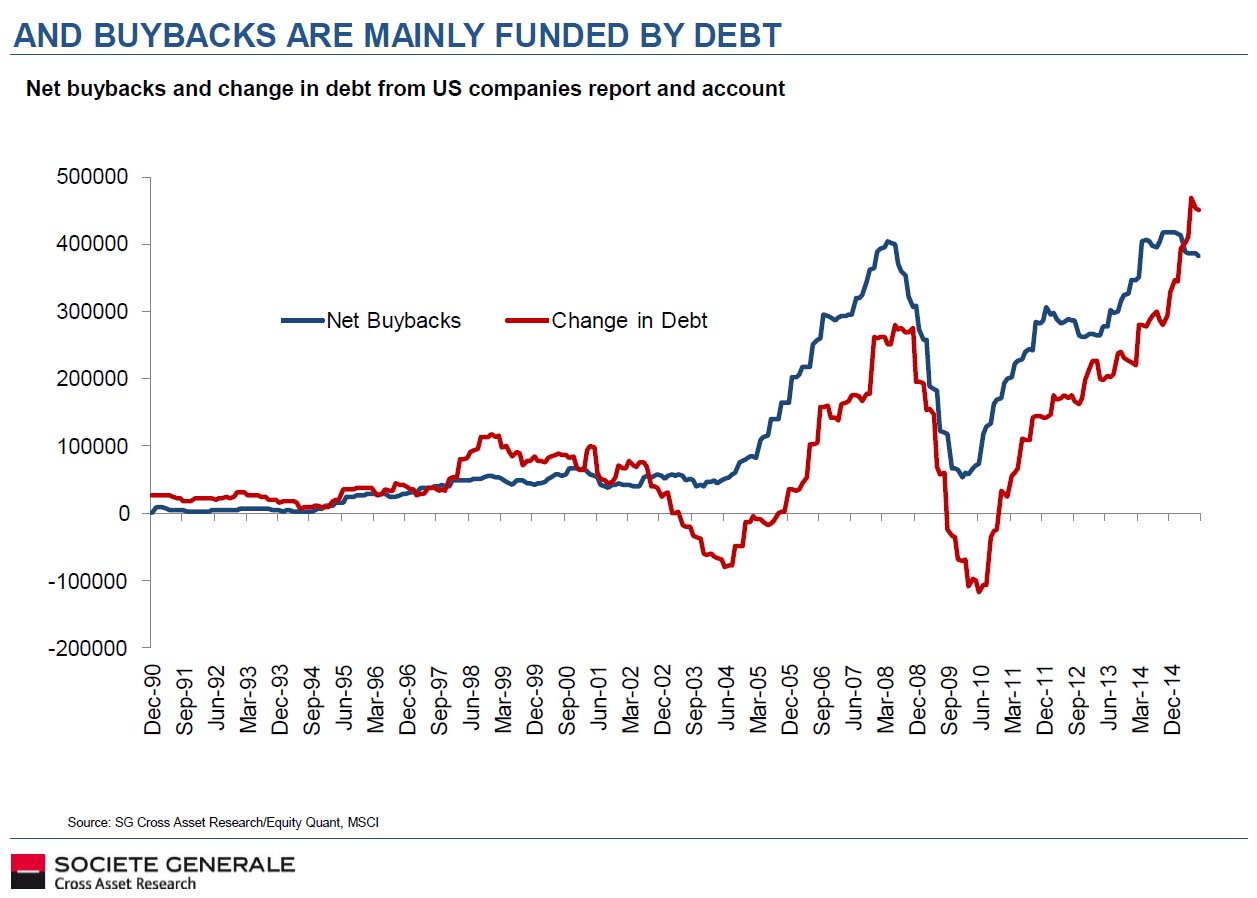
Europe is divided regarding its course of action against this flood of migrant resulting in inaction; meanwhile the flow intensifies: at the beginning of October 2015 the flow has increased to over 10,000 new migrants daily in Germany. Today we will explain how an armed conflict over a gas pipeline triggered this mass migration and considering the geopolitical consequences, forecast where oil prices will go from here.

The Heir to the Throne

In 1994, an unassuming eye doctor in London got a call to tell him that his brother had died unexpectedly in a car crash and that he had to move back in with his parents. Why? His father was Hafez al-Assad, the internationally reviled dictator of Syria, and our humble eye doctor was now commanded to prepare for his new inheritance - the Presidency of Syria.
Bashar al-Assad became president upon his father's death in 2000. He married the charming British-born Asma Akhras in December. Hafez al-Assad's foreign policy had been against the Western powers, which he resented for the colonial occupation of his country, and pro-Soviet Russia, which had sent military assistance and arms to Syria. The Western-leaning young couple worked to thaw relations with the developed world.
The Assads were invited to the capitals of Europe and forged friendly contacts with world leaders. By 2010, with the ruins of Saddam Hussein's regime smoldering in Iraq and a peace deal signed in Palestine, suddenly the path was clear from oil and gas producers in the Middle East, all the way to Europe. There remained just one last country to bring onside in order to get oil and gas piped through to a high demand region. That country was Syria.

Once Upon a Pipeline

As oil-price.net reported back in 2012, Qatar needed to get its Qatar-Turkey" pipeline through Syria, and Europe looked forward to linking up with the world's largest gas producer because it was over-dependent on Russian supplies. Russia's unstable president Vladimir Putin had previously cut off gas supplies to Europe in the dead of winter 2009 after a dispute with Ukraine over gas royalties. The Russian military has since invaded Ukraine and given Putin's aggressive stance, Europe now urgently needs to find an alternate gas supply not controlled by Russia. This makes a middle-eastern pipeline coming through Syria a very attractive proposition.
The Assads soon realized that they were in a position of power. They decided to up the ante by creating an alternative source of fuel for a trans-Syrian pipeline. Most of the countries in the Middle East, including Syria are majority Sunni Muslim. The post-Hussein regime in Iraq was dominated by Shia Muslims, The Assads are Alawite Muslims - a Shia creed that the Sunnis from Qatar and Saudi Arabia would like to see wiped off the earth. So instead of the Qatar-Turkey pipeline, Assad stitched together a deal with the Shia administration in Iraq, together with Iraq's other neighbor, Iran - the largest Shia nation in the world. The Iran-Iraq-Syria pipeline project was born.
Map of Iran-Iraq-Syria pipeline and Qatar-Turkey pipeline
Syria's economy was underdeveloped and the Assads needed oil money to keep their people placated. Their alternative pipeline plan would carry Iran and Iraq's gas to Europe, instead of gas from Qatar, and that option pleased Russia's Putin, because he already had long standing agreements in place with Iran, who were more amenable to gas price coordination with Russia. Moreover, as a long-term supporter of Syria, Russia had built up influence within the administration and the armed forces. Also Russia's only military base in the Mediterranean is located on the coast of Syria which would strategically allow Putin to control a second gas pipeline to Europe. Naturally this Iranian pipeline to Syria quickly became a top priority for Moscow. Assad and the Russians worked their contacts to dissuade the Qatar deal and promote the Iranian plan. Bashar and Asma thought they had forced Europe and the Gulf States to up their offer. Instead, they had made some very dangerous enemies.

Saudis need Assad overthrown

Saudi diplomatic efforts and generous contracts to US and UK arms manufacturers gave the Kingdom an unwritten call on the military of Western powers to fight its war for it. And so the Saudi king merely needed to lift a finger for President Obama and Britain's Prime Minister Cameron to schedule air strikes against Syria in an effort to overthrow Assad. At the end of August 2013, however, the British parliament voted against the action. That put pressure on the US president who calculated that Congress would follow suit and block any attack on Syria as well. Russia raised the stakes by moving warships into the Mediterranean, ready to defend Syria. Saudi Arabia's friends backed down, and the Saudi king resolved to solve the problem of Syria himself.
As Iran is liberated from US-imposed embargo, two power blocks have emerged in the Middle East - Iran, Iraq and Syria, which are all Shia-led, and the rest of the Arab world, which is Sunni and stands against the Shia. While America holds the alliance of the Sunni world, Russia is siding with the Shia-controlled nations.
Saudi Arabia and Qatar's first move was to fund the Muslim Brotherhood, which intended to impose Sunni control on all Middle Eastern countries. The Saudis persuaded the United States to endorse this policy and western media put a marketing spin on the rebellions of these Muslim fundamentalists, by dubbing their power grab "the Arab Spring". Once the Brotherhood's intolerance started to emerge in power, the US backed out and the Saudis tried a different tack.
The Saudis had another trick up their sleeve. Not only did the US refuse to overthrow Assad, but they then opened negotiations to loosen the oil embargo on Iran. The prospects of Iran coming back to the international oil market would heighten the growing over-supply of crude oil. Usually in these situations, OPEC was expected to cut its production to reduce oversupply in the oil market and make oil production profitable for all the other countries in the world. Saudi production quotas so exceed those of all the other OPEC nations that no production cut would be meaningful if the Saudis refused to cooperate.
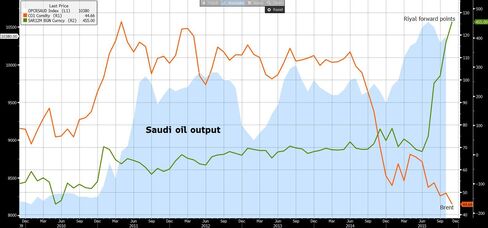
The Saudis came up with a new strategy that would punish Russia for their intervention in Syria, stall Iran from retooling its oil industry and cripple America's fracking production. They increased oil production and aggressively offered low oil prices to grab market share. The oil price fall conveniently stymied all the parties involved in keeping Assad in power.

Proxy War in Syria

Qatar and Saudi Arabia have been heavily involved with fostering and funding Sunni Muslim insurgent groups in Iraq and Syria, including the much-publicized ISIS. Disaffected and experienced Sunni administrators and soldiers in Iraq poured into ISIS, who offered them wages and self-respect.
ISIS are funded by Saudi Arabia and Qatar donors, but not controlled by them. Their leaders found it easy to quickly grab the Sunni dominated areas of Iraq and Syria, aided by the downtrodden locals. However, they have shown an ambivalent attitude in their administration. The leaders of national branches of ISIS seek income opportunities to enable them to advance ahead of rival branch leaders and gain policy independence from Saudi Arabia. In northern Iraq, they run the oil refineries they take over to make a profit. In Libya, they destroy them as offenses to God. The Libyan branch of ISIS prefers the easy money of people smuggling. Established smuggling routes also serve the long-term strategic ambition to project fighters worldwide.
ISIS-lead upheavals in Syria create a crisis that refugees are fleeing from, the ISIS-lead smuggling operations in Libya offer those refugees a route into Europe.

Labor Shortages

It is no coincidence that Germany suddenly decided to offer very generous welfare rewards to any illegal immigrant who can make it over the Mediterranean from the Libyan coast to Italian islands. Germany needs guest worker labor from poorer countries in order to keep its manufacturers competitive.
Germany's ability to continue exporting in the face of a high wage economy is hailed by their government as a tribute to the German education system. In truth, behind the scenes, the German government knows very well that their low wage, high output economy is a tribute to the Turkish education system. Despite objections from the general public, the German government has allowed unrestricted migration from Turkey since the 1980s. The low wage ambitions of migrant Turkish factory workers undercut the negotiating powers of German trade unions. German workers had to keep their wage demands low to keep their jobs from being handed over to Turkish unskilled labor.
But the economic emergence of Turkey in recent years caused the flow of cheap labor to Germany to dry up. Now the German government finds itself scrambling for more migrant labor to stave off inflationary pressures.

Divided Europe

The new German policy of serving its own interests, in hindsight can be seen as a long-term movement from the country's hope for European harmony, to its hegemony of the continent. The Schengen Agreement removed all border controls between EU member states. This was a step towards Germany's original goal of merging itself into a wider country. However, the downside of borderless Europe is that any illegal migrant who can make it into Italy, Greece or Spain then has the whole of the EU to roam across unhindered. Germany turned that weakness to its advantage in its endeavor to source cheap labor. Their siren call to the downtrodden of the Muslim world has seen the countries of southern and eastern Europe overrun by ambitious economic migrants. Germany received twice as many asylum applications in 2014 than Turkey did.
Towards the end of August 2015, Germany made matters worse by declaring that they would accept all refugees arriving from Syria. Unsurprisingly, the number of asylum seekers crowding into dinghies on the Libyan coast surged. The number that claimed to be Syrian went through the roof. By September, German officials estimated that 20 per cent of migrants arriving in that country are from Syria. The large majority is from other countries such as Sudan, Somalia and Afghanistan.
The German call for cheap labor worked well - too well. In 2014, 173,000 migrants applied for asylum. German officials estimate that this year, that number will be between 800,000 and 1 million. Their success has convinced many to follow suit - an estimated 20 to 30 millions are now considering migrating from the middle east to benefit from Europe's welfare system.
Although the German government wants a lot of migrants, its neighbors plagued with double-digit unemployment don't and European countries started re-imposing border controls. The Europhile dream of a borderless continent was trampled underfoot by Germany's grab for cheap labor.
In fact there is already ample statistical evidence that this "welfare migration" has significantly hurt European economies. In the Netherlands, 70% of Somalis live on welfare versus just 3 per cent for the native Dutch and 2 per cent for Polish migrants. According to Norway's Central Bureau of statistics, each non-European immigrant costs $660,000 over his lifetime.
Britain's experience echoes the continental figures. Over the last 17 years Britain has spent $180 billion on immigrants from outside the EU, namely on welfare, while foreign workers from within the EU contributed $6.6 billion to the British economy.
There is also an increased risk of terrorism - ISIS fighters are among migrants. According to Mike MCCaul, chairman of the House Homeland Security Committee, "From a national security standpoint, I take ISIS at its word when they said, in their own words, 'We'll use and exploit the refugee crisis to infiltrate the West.' That concerns me." According to Lebanese officials, 2.2 per cent of Syrians crowding refugee camps are affiliated with ISIS. In other words, of the 10,000 migrants arriving in Germany daily, 220 are war-hardened ISIS fighters - though many others have comparable affiliations.
Germany's neighbors were not the only ones complaining about the policy of attracting unfiltered migrants - the German electorate rose up in protest in the face of this unprecedented geopolitical risk.

History repeats itself

A similar geopolitical situation unfolded in Lebanon 40 years ago. Back in the 60s and early 70s, Lebanon was a very westernized and dynamic center of regional trade. It was a former colony of France with a strong Christian presence dating back to the crusades. Beirut was often compared to Switzerland or Hong Kong and earned the nickname of "the Monaco of the Middle East".
At that time, nearby Jordan was housing 400,000 Palestinian refugees from the war with Israel. These refugees, embittered by their experience, turned fundamentalists. Their allegiance to the PLO was increasingly problematic so the King of Jordan evicted them. Homeless, and penniless Palestinians headed for prosperous Lebanon. Insisting on maintaining their traditional values, they created "a state within a state" under Sharia law against Lebanon's secular democratic model. Tensions increased as native Christians were soon outnumbered by Muslims and in 1975 a fully-fledged civil war broke out where countless were killed.
Today no-one would seriously compare Lebanon to Switzerland as they once did. We should remember three key facts, though. First, it took 400,000 refugees to destabilize of a westernized country of 2.6 million, or a ratio of roughly 1 to 7. Second, is that Lebanese leftists perceived the war as a "class struggle" (the poor against the rich) so they fought alongside Muslim fundamentalists against Christians during the Lebanese civil war. Finally, demands for welfare and the draining expense of expanding an army, frittered away Lebanon's wealth as all commerce stopped and the tax base disappeared

Domino Effect

The German government has found itself a clever formula. It has agreed to let in more than a million migrants this year, but it hasn't agreed to let them stay. This wordplay around the status of their visitors gives Angela Merkel a sufficient glow of piety to put her in pole position for the Nobel Peace Prize this year, but doesn't actually commit them to grant passports to anyone.
Germany has implemented a nine month selection window to keep the brightest migrants, who will plug their labor shortage. That's right, keep the best, reject the rest, but what will happen to those who cannot assimilate to a western society and are rejected? They can't be sent back to a war zone, and they can't remain in Germany. The borderless Schengen area provides the solution. In fact Germany is already laying plans for where to send its rejects. They forced through an EU ruling in late September which obliges other EU countries to take a percentage of refugees off their hands.
Some European leaders have been able to spot Germany's tactics and have already cried foul. The ensuing name calling and outright venom that flew between Berlin and Budapest, seat of the leader of the no-voting block's leader, Viktor Orban, shows cracks appearing in European unity.
Economic need may force the refugees to move on. Cut off from the much advertised generous state benefits in Germany, they will merely up sticks and mob over the borders to Austria, Poland, France and the Netherland in search of more handouts. As they link up with leftist radicals and religious extremists of those countries, a Lebanon style rebellion could develop.
While Germany, with 81 million people may be able control 1 million migrants (albeit not easily), it would spell doom for its smaller and vulnerable European neighbors, namely Denmark, Finland, Slovakia and Norway - each with 5 million inhabitants - much like it did in Lebanon 40 years ago.
There will be a "domino-effect" among European nations re-introducing pre-EU strong border controls, as Hungary has already done. This will significantly reduce trade between EU countries. Fewer trucks on the road mean less energy consumption, less commerce and lower tax revenues, higher deficits and a weakening Euro.
When the populations of Germany's neighboring countries get let in on Berlin's refugee filtering trick, the anger and mistrust between European nations that has been repressed for the last 25 years will resurface and may split the EU apart. Europe's competitive advantages will ebb away. We can expect that some strategic industries - those who can - flee Europe's geopolitical risk. Coincidently, Airbus SA recently announced its plan to relocate production of the upcoming A320 airplane to Mobile, Alabama USA instead of France. Going forward Europe's image will suffer irreparable loss while North America and Asia will remain stable and open for business.

Unintended Consequences

Oil-price.net has a long track record of successfully forecasting geopolitical risks tied to petroleum. In 2012 we predicted that armed militias would seize oil fields in Sudan, Libya and Nigeria and warned of the potential disaster that factions can cause in that region. The unintended consequences of the US invasion of Iraq switched the dominant religion in that country and created a Shia corridor from the heart of Afghanistan through to the Eastern Mediterranean coast; and made Saudi Arabia feel threatened.
The Saudi and Qatar plan to switch the Syrian government from Shia to Sunni promised the reward of a clear Sunni corridor from the gulf to the frontier of the European Union. However, their methods of achieving that goal drove Syria to plan a pipeline benefiting Iran and unleashed the chaos of extremist control of large areas of Iraq, Syria and Libya.
An unintended consequence of Europe's support for a Qatar-Syria gas pipeline free of Russian influence was the migrant crisis currently flooding Europe. The German government's idea to exploit the overwhelming tide of asylum seekers to gain cheap labor backfired into the de-unification of Europe.
The blowback caused by Saudi policy over the past few years extends beyond the Middle East, and it still hasn't played itself out.

The King of Oil and the Emperor of Gas

The Saudis intended to cripple Russia, Iran and US frackers through lower oil prices. However, all of those countries have joined the Saudis in increasing production since the price of oil started to fall in 2014.
If anyone is going to blink first, it won't be the USA, where some frackers have reduced their production costs from $70 per barrel to $20 per barrel.
Vladimir Putin based his entire political strategy on the exploitation of oil and gas, both as an income generator, and as a weapon against his perceived enemies. Russia's long term answer to the Saudi punch of lower oil prices had been in the making since Putin scared off the USA and the UK from bombing Syria. He didn't move his battleship to the Syrian coast as a gesture. He set himself up as the military overlord of Syria and took control of the one access point common to both the Iranian and Qatari pipelines.
The sudden revelation of the extent of Russia's involvement in Syria hit newsstands in early October 2015 when the Russian air force started bombing rebels in Syria. With international law on its side, Russia is defending the legitimate Syrian government against Saudi-backed terrorists.
Putin needs the income that his oil industry brings his government. The oil price drop and the Western sanctions against Russia hurt. His favorite industry, however, is gas. Russia controls 70 per cent of gas supplies to Europe and that brings him political advantages, as well as the ability to set falsely high gas prices. Europe's resolve to block trade with Russia will soon weaken during the freezing winter. With no hope of a pipeline bringing Middle Eastern gas through Syria, German-lead Europe will be easier to deal with. Russia is well placed to become Iran's new best friend. Putin is sitting pretty.

The Saudi Endgame

Saudi Arabia itself has a belligerent population and its government keeps the lid on dissent by being very generous with sweeteners for its people. Those subsidies are expensive and now that they are selling oil near cost price, the Saudi government is drawing down its saving.
The Saudis are running out of money and Western governments are starting to realize that they would rather Assad survived in office to help them fight the Saudi-funded ISIS. The comfortable relationship between the governments of Saudi Arabia and the USA seems to have broken down. A growing awareness among the populations of the West that Saudi Arabia funds terrorist organizations makes it harder for those democratic governments to make moves to support the Saudi King. So, Saudi Arabia is losing its big military ally, while Iran, Iraq and Syria become more closely involved with Russia.
Low oil prices have become the new normal. The only way they will ever change is if a large amount of world oil output gets knocked out. It turns out this may be in the cards.
In booting ISIS out of Syria, Russian military planners most certainly will use a strategy called "funneling". Quite simply, with the assistance of allied Iran to the east, Russia will attack ISIS troops anywhere but south, forcing a retreat in that direction, thus "funneling" ISIS fighter south into rival Saudi Arabia. ISIS may find grassroot support within the kingdom and their natural target will first be -as always- oil fields. The resulting shortfall in oil and gas production will enable Russia and Iran to incease military spending and extend their strategical influence on the region, much like the US did.
An unintended consequence of the Saudi attempts to overthrow the government of Syria, may be the overthrow of the government of Saudi Arabia with its own medicine. Should ISIS be pushed into Saudi Arabia, expect oil prices to surge.

Nifty...


Buy Nifty @ 7920-7885
Stoploss 7835

Friday, November 27, 2015

First Prime minister who has been criticized for working hard.


Since last few days, We have  seen quite a few jokes on Narendra Modi's foreign visits.... and all people are curious why Narendra Modi visits so many countries and what is India achieving from it.
Few hidden because the main stream media will purposely ignore them) achievements are given below:

1. BJP Govt. convinced Saudi Arabia not to charge “On-Time Delivery 1Premium charges" on Crude Oil – Young Petroleum Minister Dharmendra Pradhan & External Affairs Minister Sushma Swaraj sealed the deal. Saved the country thousands of crores...

2. India will build 4 Hydroelectric power stations + Dams in Bhutan (India will get lion's share in Green energy that will be produced in future from these projects) . .

3. India will build Biggest ever dam of Nepal (China was trying hard to get that) – India will get 83% Green energy produce from that hydro power station for free – in future. . . 
4. Increased relationship with Japan and they agreed to invest $30 Billion in DMIC (Delhi –Mumbai Investment Corridor)..

5. Increased strategic relationship with Vietnam and Vietnam has now agreed to give contract of Oil exploration to ONGC-Videsh (UPA was not ready to take this at all because they were worried about China – and getting into a conflict of interests on south China sea)

6. Increase Oil Imports from Iran, despite the ban by USA. Iran agreed to sell in Indian Rupees and it saved our Forex, not just for now, but protected India from future currency fluctuations. India also gets to build “Chabahar” port of Iran, encircling Pakistan. Because we well have exclusive access for our Naval ships in this port.

7. Australia- despite Australia being a major supplier of Coal & Uranium. . NaMo was able to convince Tony Abbott and now Australia will supply Uranium for our energy production.

8. China leaning President Rajapakse lost elections in Sri Lanka – Remember UPA lost “Hambantota” port development – read latest report of CIA, where they mention RAW has played a major role in power shift of Sri Lanka. Sri Lanka has backed out of Chinese contract and shifted to Indian project managers.

9. With China, as Trade Deficit was increasing, NaMo forced their hand. Anti-Dumping will come soon so China will invest heavily into India. – China has already committed $ 20 billion Investment in India. That's nearly ₹140,000 crores.

10. On Security – I think adding Ajit Doval to his team is the best decision by NaMo. See the recent tie-up with Pentagon, Israel & Japan. . Now see how we stopped the Terror Boat and listen to his words … “Any Mumbai like attack from Pakistan and Pakistan will lose Baluchistan!" That's the language of deterrence that I want to hear as an Indian. We won't hit first, but if you do, we surely won't turn the other cheek....

11. India approved the border road in the NorthEast and around India- China border – Remember just because of China’s opposition, the ADB (Asian Development Bank) didn’t give us funds during UPA regime and UPA held that file under “Environment Ministry control – Remember the infamous “JAYANTHI TAX "? No one bothered about the disastrous effect on our armed forces.

12. India managed to bring back 4,500+ Indians from War zone in Yemen and also brought foreign nationals of 41 different countries, which put India’s name onto the highest platform globally in conducting that rescue mission – PM Narendra Modi specially talked to the new Saudi Arabian king Salman and told him to allow Indian Airforce planes to fly – as Saudi Arabia was attacking on Yemen and Yemen skies was declared NO-FLY Zone: thanks to this we got an assured clear window of a few hours and guys guess who coordinated this? Ajit Doval, Sushama Swaraj and Gen V K Singh. All in person.... When was the last time you ever heard of ministers involved personally in such efforts that didn't fetch thousands of crores?? Guess the religion of those rescued?? But it isn't secular.

13. India’s Air defense was getting weaker by the day, UPA was very happy to let it happen despite repeated specific inputs from the armed forces, NaMo renegotiated Rafale fighter Jets deal with France personally and bought 36 Jets on ASAP basis. At better than rack rates. No middlemen, no commissions

14. For the first time after 42 yrs Indian Prime Minister visited Canada not to attend some meeting but as a specific state visit, in a Bilateral deal, India was able convince to Canada to supply Uranium for India’s Nuclear reactors for next 5 years. It will be of great help to Resolve India’s Power problems. . . .

15. Canada approves visa on arrival for all Indian tourists. 

16. Till recently we were exclusively buying Nuclear Reactors from Russia or USA and it was much like beggar kind of situation because they were worried about usage of Nuclear reactor for some other use. So only what they opted to give us, we could get. Now Narendra Modi was able to convince France and now France will make Nuclear reactors with the latest technology in India. On MAKE IN INDIA  
       efforts with collaboration with an Indian company as a partner    
  
17. During 26th Jan. visit of Barack Obama , NaMo convinced USA to drop rule of Nuclear fuel tracking and sorted out Liabilities rules which now open the gates for next 16 Nuclear power plant projects. . . . Isn't this good enough to improve the lot of India?

The paid media will ensure you never get to hear this.. Spread the word.. It's worth the trouble..

Nice to see a PM with vision and patriotism

Nifty..


Buy and Nifty @ 7860

Stoploss 7800

Thursday, November 26, 2015

US LEI. US still booming.

The Conference Board Leading Economic Index® (LEI) for the U.S. increased 0.6 percent in October to 124.1 (2010 = 100), following a 0.1 percent decline in September, and a 0.1 percent decline in August
Smoothed LEI
LEI has historically dropped below its six-month moving average anywhere between 2 to 15 months before a recession. The latest reading of this smoothed rate-of-change suggests no near-term recession risk.

Nifty

No fresh figures for Nifty today Being a settlement day.
We start with new contract tomorrow..

Wednesday, November 25, 2015

The Bubble Right In Front Of Our Faces -by John P. Hussman, Ph.D.

Cutting immediately to the chase, we continue to believe that the U.S. equity market is in a late-stage top formation of the third speculative bubble in 15 years. On the basis of measures best correlated with actual subsequent S&P 500 total returns across history, equity valuations remain obscene. We fully expect a loss in the S&P 500 in the range of 40-55% over the completion of this cycle; an outcome that would be wholly run-of-the-mill given present market conditions, and would not even bring reliable measures of valuation materially below their longer-term historical norms.
Following the steep but relatively contained market plunge in August, the major indices rebounded toward their May highs, but neither the broad market nor high-yield credit participated meaningfully. Only 34% of individual stocks remain above their respective 200-day averages, widening credit spreads suggest growing concerns about low-quality debt defaults, and sectoral divergences (e.g. relative weakness in shipping vs. production) confirm what we observe in leading economic data — a buildup of inventories and a shortfall in new orders and order backlogs. Employment figures lag the economy more than any other series.
When investors are risk-seeking, they tend to be indiscriminate about it. If market internals were uniformly favorable, suggesting that investors remained inclined toward yield-seeking speculation, we could at least expect that continued speculation might defer immediate market losses, or possibly drive valuations to even more offensive levels. Fed easing (or the decision not to raise rates) might be bullish in that environment. But as investors should recall from Fed easing in late-2007 and early 2001, just as market collapses were beginning, Fed easing is among the most bearish possible events when it occurs in an environment of rich valuations and unfavorable market internals, as such easing is typically provoked by concern about economic deterioration.
In the absence of favorable internals, we conclude not only that risk premiums in equities are razor thin, but that the continued shift toward risk-aversion among investors leaves the market vulnerable to abrupt spikes in risk premiums. This is an environment that has historically left the market open to vertical air-pockets, panics, and crashes.
The bubble right in front of our faces
Investors don’t like to acknowledge bubbles. And because they’ve been so prone to deny them, bubbles (and their consequences) have become a recurring part of the financial landscape over the past two decades. During the late-1990’s technology/dot-com bubble, debt-financed malinvestment was mainly directed toward internet-related companies. The end result was a collapse in the Nasdaq 100 of -83%, while the S&P 500 lost half its value. By the 2002 low, the entire total return of the S&P 500 — in excess of Treasury bills — had been wiped out, all the way to back May 1996.
It has taken yet another full-fledged multi-year speculative bubble to get the Nasdaq back to even (most likely only temporarily), and to bring the total return of the S&P 500 since 2000 to even 4% (again, most likely only temporarily). By the completion of the current market cycle, we fully expect that the total return of the S&P 500 since the 2000 peak will fall to zero or negative levels for what will then be a roughly 17-year span, and that the S&P 500 will have underperformed Treasury bills all the way back to roughly 1998; what will then be a nearly 20-year span.
As a reminder of how unwilling investors are to acknowledge bubbles, one must remember that in 2000, even before the S&P 500 even reached its final bull market high on a total-return basis, a broad range of dot-com stocks had already collapsed by about 80% from their own 52-week highs. Investors were finally willing to acknowledge that bubble only after it collapsed, but somehow continued to believe that the bubble was contained only to dot-com companies, and continued to push the S&P 500 higher. Consider this gem from the Wall Street Journal, which appeared in July 2000 with the title “What were we THINKING?”
“For a while it seemed that risk was dead. Now we know better... Why didn’t they see it coming? Arrogance, greed and optimism plus fear of being left out blinded people to the risks. After all, the dot-commers embraced risk. They prided themselves on their willingness to gamble and used it to justify their lucrative stock-option plans. Unfortunately, at the extreme far end of the risk curve, people lose perspective.”
All of that apparent learning, stated in the past tense, might have been well and good were it not for the fact that the S&P 500 was still at record highs, at the most extreme valuation in history, and the broader collapse had not even started. The tech-heavy Nasdaq 100 was down -14% from its March 2000 high, but would go on to lose another -80% by its October 2002 low. Many of those companies were, and remain, outstanding businesses. But just as a parabolic stock price advance is no assurance that the underlying business is sound, having a sound underlying business does little to prevent an overvalued stock from collapsing once investors lose their taste for speculation. Investors have a habit of pointing to past bubbles as if they have actually learned something, even when they are in the midst of another one.
By 2007, the S&P 500 had again reached record highs, though the market’s total return from the 2000 peak was still only about 2% annually. The preferred object of speculation during the housing bubble was mortgage debt. With the Federal Reserve suppressing yields to just 1% in 2003, yield-seeking investors found higher returns in mortgage securities, Wall Street jumped to create new “product,” credit standards were lowered, debt was “financially engineered” to bundle it in ways that could get a rubber stamp from ratings agencies, and unsound debt filled the portfolios of insurance companies, banks, and hedge funds. By the March 2009 low, the entire total return of the S&P 500 — in excess of Treasury bill returns — had been wiped out all the way back to June 1995. Investors, analysts, and economists look back on that bubble, and the global collapse that followed, as if they have actually learned something.
So here we are, in what in hindsight will likely be called the “QE Bubble” — a moment in history where the most reckless and intentional encouragement of speculation by central bankers actually came to be viewed as not only acceptable but welcome. This is tolerated despite the fact that activist departures of monetary policy from simple rules (such as the Taylor Rule) have absolutely no correlation with subsequent economic activity. This is tolerated despite the clear evidence that yield-seeking speculation was the primary driver of malinvestment that created the housing bubble and economic collapse. We’ve still evidently learned nothing.
The preferred object of debt-financed speculation this time around is the equity market. As for direct debt-finance of equity speculation, margin debt soared to more than $500 billion in April, 2.8% of GDP, eclipsing the 2000 and 2007 record highs. One should not compare margin debt to equity market capitalization, but rather to a fundamental; otherwise, the existence of a bubble in prices can make even alarming levels of margin debt appear reasonable. The recent level of stock margin debt is equivalent to 25% of all commercial and industrial loans in the U.S. banking system. Meanwhile, hundreds of billions more in low-quality covenant-lite debt have been issued in recent years. As a ratio of corporate gross value added, both corporate debt and the market value of corporate equities have climbed to the highest levels in history. Our friend Albert Edwards shares another interesting observation: the surge in corporate debt maps closely to the volume of net corporate equity buybacks.
The preferred objects of speculation, and the greatest casualties of the 2000 bubble, were technology and dot-com companies. The preferred objects of speculation, and the greatest casualties of the mortgage bubble, were housing and the financial companies that held those mortgages. Recognize that because QE provoked such indiscriminate speculation, the recent extremes in the median price/earnings and price/revenue ratios, across all stocks, actually surpassed their 2000 peaks. Make no mistake: the preferred objects of speculation during the QE bubble have been low-grade debt and the entire stock market, indiscriminate of industry, sector, quality, or capitalization. We are now beginning to observe internal divergences that signal increasing risk aversion among investors. The greatest casualty of the QE bubble will also likely be low-grade debt and the entire stock market, probably just as indiscriminately.
Investors don’t like to acknowledge bubbles. Yet somehow we have little doubt that a few years from now, they will look back at the present moment and ask that tragically perennial question: “What were we THINKING?”
Choose your weapon
As a brief valuation review, the chart below shows a variety of the most historically reliable valuation measures we identify, charted as percentage deviations from their historical norms. Note that raw price/forward earnings and the Fed Model are not among them, because their correlations with actual subsequent market returns are rather weak (though we’ve seen charts that make them look compelling as long as one ignores enough history). I wrote my August 20, 2007 market comment Long-Term Evidence on the Fed Model and Forward Operating P/E Ratios, to counter what I viewed as misguided claims of “reasonable valuation” at a time when, as now, historically reliable measures were quite extreme. That said, one can obtain a fairly useful valuation measure by adjusting the forward P/E to reduce the impact of cyclical fluctuations in profit margins. To obtain historical data before 1980, one has to impute based on other observable information (as explained in that 2007 article). That’s because forward operating earnings are an object created by Wall Street, not by Generally Accepted Accounting Principles.
As I noted in Valuations Not Only Mean-Revert; They Mean-Invert, reliable valuation measures typically fully mean-revert within a 12-year horizon, meaning that there is no relationship between initial overvaluation (or undervaluation) and the level of overvaluation (or undervaluation) 12 years later. It follows that the most reliable horizon to relate valuations with subsequent equity market returns is also about 12 years. It’s also worth noting that since 1950, there has been no material relationship between interest rates and their level 12 years later. The following are the correlations, since 1950, between each valuation measure and actual subsequent S&P 500 nominal total returns over the following 12-year period. The correlations are negative because higher valuations are associated with lower returns:
Shiller P/E: -84.7% correlation with actual subsequent 12-year S&P 500 total returns
Tobin’s Q: -84.6% correlation
Nonfinancial market capitalization/GDP: -87.6%
Margin-adjusted forward operating P/E (see my 8/20/10 weekly comment): -90.7%
Margin-adjusted CAPE (see my 5/05/14 weekly comment): -90.7%
Nonfinancial market capitalization/GVA (see my 5/18/15 weekly comment): -91.9%

Choose your weapon. We view all of these measures as reasonably reliable (in comparison with a broad range of popular but largely worthless alternatives), but even here there are differences. Tobin’s Q and the Shiller P/E are currently the least extreme relative to their pre-bubble historical norms (75.5% and 99.6% overvalued, respectively), but they are also not as reliable as the other measures. Interestingly, market capitalization to GDP (which Warren Buffett once cited in a 2001 Fortune interview as “probably the best single measure of where valuations stand at any given moment”) is the most extreme among these, at more than 145% above its pre-bubble norm, implying a -59% market drop simply to restore that norm — not even to move to historical undervaluation. While Buffett hasn’t said boo about this indicator in recent years, it’s certainly not because it has lost its correlation with subsequent market outcomes in recent market cycles. Indeed, the correlation of Market Cap/GDP with subsequent 12-year S&P 500 returns since 1980 (capturing multiple recent market cycles) is even stronger at -93.0%. The same is true among all of these measures. Still, even MarketCap/GDP isn’t the most reliable measure presented here.
Not surprisingly, if one had to choose a single weapon on the valuation front, my preference would be one of my own: nonfinancial market capitalization to corporate gross value added, inclusive of estimated foreign revenues (see my 5/18/15 comment introducing this measure). At present, MarketCap/GVA is about 128% above its pre-bubble norm, and implies negative 10-year S&P 500 nominal total returns, with expected 12-year S&P 500 nominal total returns averaging only about 1% annually.
In the chart below, the blue line shows MarketCap/GVA on an inverted log scale (left). The red line shows theactual subsequent 12-year annual nominal total return of the S&P 500 in percent (right scale).
If it seems preposterous to expect such dismal market returns over a 10-12 year period, recall that the S&P 500 did worse than that after the 2000 market peak. In my view, the most likely path to dismal market returns is the one that has been most typical historically: a major bear market loss, followed by a long period of reasonably positive average returns that recover the loss over time. For example, either of the following possible outcomes would result in a 12-year total return just over 1% annually: a) a -47% market loss over 2 years, followed by a 10-year period in which the S&P 500 achieves a positive total return of 8% annually, or b) a -55% market loss over 2 years, followed by a 10-year period over which the S&P 500 achieves a positive total return of 10% annually. The reason I used those particular figures is that they correspond to the 2000-2002 and 2007-2009 collapses. Interestingly, if this sort of scenario actually emerges, the red line in the preceding chart will fit over the blue linelike a glove. I expect we’re in for quite a loss in the S&P 500 over the completion of the present market cycle.
What about interest rates?
Investors may wish to believe that low interest rates somehow, by their very nature, are sufficient to prevent such losses. They may do well to recall that Japanese stocks plunged by -62% in 2000-2003 and -61% in 2007-2009 despite interest rates that never exceeded half of one percent. There are certainly structural differences between Japan and the U.S., but those differences do not extend to eliminating the iron laws of investing; that every security is a claim on some stream of expected future cash flows, and the higher the price one pays for those cash flows, the weaker the long-term rate of return. Recall also that the historical correlation between interest rates and equity valuations has actually been zero outside of the disinflationary 1980-1998 period. Suppressed interest rates can certainly encourage yield-seeking speculation, helping to drive equities and other securities to extreme valuations that offer similarly dismal prospects for future returns. But when investors turn risk-averse, as they did in 2000-2002 and 2007-2009, those dismal prospects are realized, and even persistent and aggressive Fed easing has not prevented U.S. equities from collapsing.
Similarly, it’s tempting to assume that interest rates will remain so low in the future that investors will maintain stocks at extremely high valuation levels, with no tendency toward mean-reversion at all. The fact is that the correlation is very weak between interest rates at one date and interest rates 10-12 years later. More importantly, however, there is a 90% correlation between interest rates at any given date (e.g. the 10-year Treasury bond yield) and nominal economic growth over the preceding decade. So if you’re assuming that interest rates will be low a decade from now, you’re also effectively assuming that nominal economic growth will be dismal.
The question of whether interest rates should directly enter a valuation model depends on what one is doing with it. If one wishes to estimate the long-term expected rate of return on a security, all that’s required is the expected stream of future cash flows and current price. In contrast, one might wish to reverse that question, and calculate the price that would be consistent with some required rate of return. In this case, interest rates come into the model only as a way of deciding what return one wishes to obtain. Given expected future cash flows and that required rate of return, it is then just arithmetic to calculate the corresponding price. As I noted in our 2015 Annual Report:
“It is important to recognize that while depressed interest rates may encourage investors to drive risky securities to extreme valuations, the relationship between reliable valuation measures and subsequent investment returns is largely independent of interest rates. To understand this, suppose that an expected payment of $100 a decade from today can be purchased at a current price of $82. One can quickly calculate that the expected return on that investment is 2% annually. If the current price is given, no knowledge of prevailing interest rates is required to calculate that expected return. Rather, interest rates are important only to address the question of whether that 2% expected return is sufficient. If interest rates are zero, and an investor believes that a zero return on other investments is also appropriate, the investor is free to pay $100 today in return for the expected payment of $100 a decade from today. The investor may believe that such a trade reflects ‘fair value,’ but this does not change the fact that the investor should now expect zero return on the investment as a result of the high price that has been paid. Once extreme valuations are set, poor subsequent returns are baked in the cake.”
As a side note, many of our methods of projecting 10-year S&P 500 total returns embed the assumption of 6% nominal growth in earnings, revenues and the broad economy; a rate that has been fairly consistent when one looks peak-to-peak across historical economic cycles, despite substantial shorter-term variation. Assuming that interest rates will be strikingly low in the future is essentially equivalent to assuming nominal growth will be strikingly low. Because those two effects tend to offset each other, the relationship between valuations and subsequent 10-12 year returns has typically been unaffected.
The long-term outcomes are inevitable; the shorter-run outcomes hinge on market internals
When investors are inclined to speculate, they tend to be indiscriminate about it, so strongly speculative markets demonstrate a clear uniformity across a broad range of individual stocks, industries, sectors, and risk-sensitive securities, including debt of varying creditworthiness. In contrast, as risk-aversion sets in, the first evidence appears as divergence in these market internals. Put simply, overvaluation reflects compressed risk premiums and is reliably associated with poor long-term returns. Over shorter horizons, investor risk-preferences determine whether speculation will continue or collapse, and the condition of market internals acts as the hinge that distinguishes those two outcomes.
Valuations have been obscene for some time. Historically, the thing that has differentiated an overvalued market that remains elevated or continues higher, and an overvalued market that plunges, is the preference of investors toward risk — which is best inferred from the uniformity or divergence of market internals. Those measures have been unfavorable since the third quarter of 2014, which has opened the door to more frequent air-pockets and vertical losses. As with the 2000 and 2007 top formations, market peaks are often a process, and while recoveries on weak internals tend to be followed by fresh losses, the process can extend for months.
Overvalued, overbought, overbullish conditions have also been a rather persistent feature of the market in recent years. In prior cycles across history, similar extremes were typically accompanied or quickly followed by deterioration in market internals, and the overextended extremes were resolved by market losses. In the half-cycle advance since 2009, the Federal Reserve aggressively and intentionally encouraged yield-seeking speculation, and disrupted that overlap. One had to wait for market internals to deteriorate explicitly before adopting a strongly negative market outlook. That, in a nutshell, was our fundamental problem in this half-cycle; I responded directly to overvalued, overbought, overbullish conditions by immediately taking a negative market outlook; just as prior market cycles across history had encouraged.
I’ve regularly admitted that error, but it’s equally important to understand why the market advanced despite wickedly overextended conditions. The reason is not that Fed easing can be blindly relied upon to support speculation (it certainly didn’t in 2000-2002 and 2007-2009), but rather because extreme valuation risk is typically only realized once investors become risk averse, as evidenced by deterioration in market internals. We addressed this in mid-2014 by imposing restrictions against adopting a hard-negative market outlook until our measures of market internals have also explicitly deteriorated. We don’t get to re-live the recent half-cycle, but we do have the opportunity to move forward with methods that are historically informed by a century of market cycles, and that resolve the primary issue that made the half-cycle since 2009 legitimately “different” as a result of extraordinary monetary policy.
As I’ve noted before (see The Two Pillars of Full Cycle Investing and Air-Pockets, Free-Falls and Crashes), a more demanding emphasis on market internals is the primary factor that, in hindsight, would also have deferred ourconstructive response after the 40% market plunge in late-2008, holding off that shift until early-2009. Measures of what I’ve often called “early improvement in market action” that were effective in post-war data were too fragile and prone to whipsaw to endure the extremes of the Great Depression and the late-2008 to early-2009 period. More robust factors (particularly relating to risk-sensitive internals such as credit spreads) were necessary, and that was one of the key outcomes of our 2009 stress-testing efforts. In short, market internals are the hinge that not only distinguishes overvalued markets that continue higher from overvalued markets that collapse; they are also the hinge that distinguishes undervalued markets prone to further losses from undervalued markets that give rise to new bull advances.
The same sort of hinge operates with regard to economic prospects. As Bill Hester nicely illustrated a few weeks ago, given economic activity similar to the present, the likelihood of a recession has been remarkably higher when the equity market has been fairly weak; for example, below its 12-month average, or its level 6 months earlier. Notably, the S&P 500 is below both levels at present.
The same is also true with regard to Fed easing and Fed tightening. In the presence of rich valuations, and the absence of favorable market internals, a Fed easing is actually the most bearish event that can occur (see When An Easy Fed Doesn’t Help Stocks and When It Does), mainly because Fed easing in risk-off conditions is typically a response to continuing economic deterioration.
The overall economic and financial landscape, then, is one where obscene valuations imply zero or negative S&P 500 total returns for more than a decade — an outcome that is largely baked-in-the-cake regardless of shorter term economic or speculative factors. Presently, market internals remain unfavorable as well. Coming off of recent overvalued, overbought, overbullish extremes, this has historically opened a clear vulnerability of the market to air-pockets, free-falls and crashes.
From an economic standpoint, the most leading measures of economic activity are new orders and order backlogs, followed by sales and production, followed by income, and followed much later by employment measures. From that standpoint, the most leading measures of economic activity are clearly deteriorating, even while many observers look to the lagging employment measures as if they are predictive. In the context of poor market action, similar economic data has been associated with a high risk of recession (though we don’t currently have sufficient evidence to anticipate a recession with confidence).
As for Fed policy, in my view, there is — and has been for some time — an immediate case to be made for the Fed to stop reinvesting the proceeds of balance sheet assets as they mature. The Fed could reduce its balance sheet by $1.4 trillion without driving market interest rates higher. The only way to drive market rates higher here is for the Fed to explicitly pay banks interest on excess reserves. Given that there is no empirical evidence that activist departures of Fed policy from a fixed rule (such as the Taylor Rule) have any meaningful effect on the real economy, we’re fairly indifferent to whether the Fed raises rates or not in December. Our primary focus is on market internals here — not because an improvement would change the dismal long-term market outlook a bit, but rather because an improvement would suggest fresh risk-seeking that could defer a collapse in the nearer-term.
In the absence of improved market internals, my impression is that the economy is increasingly likely to roll into a recession at the same time the equity market rolls into a rather severe bear market decline. If the Fed raises rates in that environment, the FOMC will likely be blamed for losses that are actually already inevitable as a result of the Fed’s much earlier recklessness. If the Fed fails to raise rates in that environment, after having conditioned investors to expect a rate hike, it will likely be taken as a vote of no-confidence in the economy, and the FOMC will likely be blamed for losses that are actually already inevitable as a result of its much earlier recklessness. A uniform improvement in market internals would suggest fresh speculative pressures that could defer these outcomes, but ultimately, the only way to avoid near-term losses is to make the prospect of longer-term losses that much worse.

Tuesday, November 24, 2015

Cut Oil Supply or Drop Riyal Peg? Saudis Face ‘Critical’ Choice

he longer oil languishes, the more pressure builds on Saudi Arabia to abandon its currency peg.
Contracts used to speculate on the riyal’s exchange rate in the next 12 months climbed to a 13-year high on Thursday, before trimming the increase a day later, according to data compiled by Bloomberg. Six-month agreements rose to near the highest in seven years on Friday.
The decoupling of oil prices and Saudi production has fueled speculation of a riyal devaluation
Saudi Arabia is pumping oil at a record level this year, leading OPEC’s effort to defend market share even as oil trades near the lowest level in six years. That’s forced the kingdom to tap savings and sell debt to make up for a plunge in revenue and defend its 30-year-old peg to the dollar. For Bank of America Corp., the country may face a choice next year: cut production to help boost prices or adjust the riyal’s rate to stem a decline in foreign reserves.
“A depeg of the Saudi riyal is our number one black-swan event for the global oil market in 2016, a highly unlikely but highly impactful risk," BofA strategists led by Francisco Blanch in New York wrote in a Nov. 19 report. “It is a lot easier politically to implement a modest supply cut at first than allow for a full-blown currency devaluation."
One-year forward points for the riyal jumped 167.5 points to 525 on Thursday, before falling to 455 a day later. That reflects expectations for the currency to weaken about 1.2 percent to 3.7962 per dollar in the next 12 months. Six-month agreements rose on Friday to 152.5, near the highest level since 2008.
Weak global growth and inflation as well as a strong dollar will remain a “huge" headwind for dollar-based commodity prices, BofA said. Brent crude closed last week at $44.66 per barrel, down 44 percent from a year earlier.

Robust Reserves

Still, Saudi Arabia’s reserves are hardly depleted. While net foreign assets fell to a near three-year low in September as the government drew down financial reserves accumulated over the past decade, they’re among the highest in the region at $646.9 billion.
The country’s peg survived low oil prices in the 1990s and revaluation pressure resulting from surging prices in the late 2000s, Shaun Osborne, the Toronto-based chief foreign-exchange strategist for Scotiabank wrote last week.
Pressure may also build on the Chinese yuan amid declining reserves at central banks across the world and with expected U.S. interest-rate increases, BofA said. A meltdown of the yuan may ultimately force Saudi Arabia’s hand because of the “very high sensitivity" of commodities to the currency, the bank said.
Saudi Arabia produced more than 10 million barrels of oil a day in each of the past eight months and pumped a record 10.57 million barrels a day in July, according to data compiled by Bloomberg.

Nifty Figures...


Buy above 7880 sell below 7820

Monday, November 23, 2015

Oil Deal of the Year: Mexico Set for $6 Billion Hedging Windfall

Mexico is set to get a record payout of at least $6 billion from its oil hedges this year, according to data compiled by Bloomberg.
The Latin American country locks in oil sales as a shield against price declines through a series of financial deals with banks including Goldman Sachs Group Inc., JPMorgan Chase & Co. and Citigroup Inc. For 2015, Mexico guaranteed sales at almost $30 a barrel higher than average prices over the past year.
The 2015 payment, due next month, is set to surpass the record from 2009, when the Mexican government said it received $5.1 billion after prices plunged with the global financial crisis. The country’s crude has fallen by almost half over the hedging period so far this year. Crude sales historically cover about a third of the government budget.
"The windfall is huge," said Amrita Sen, chief oil analyst at Energy Aspects Ltd., a London-based consulting company. "This gives Mexico breathing space."
The hedge, which runs from Dec. 1 to Nov. 30, covered 228 million barrels at $76.40 each for the Mexican oil basket, according to government documents and statements. With less than two weeks to the end of the program, the basket has averaged $46.61 a barrel over the period. 
The difference would result in a payment of around $6.8 billion, not including fees. The final figure could vary from the Bloomberg estimate as some details of the hedge aren’t public and oil prices will change over the next two weeks. The Mexican oil basket fell on Nov. 18 to $33.28 a barrel -- its lowest since December 2008.
Mexico’s Finance Ministry didn’t respond to calls and e-mails seeking comment on the hedges and Deputy Finance Minister Fernando Aportela declined to provide an estimate Friday of how much money the Latin American nation would get from the program. The government will receive the proceeds in the first half of December, he told reporters in Mexico City.
The payout would dwarf the profitability of the biggest commodities trading houses and oil hedge funds. Glencore Plc, the world’s largest commodity trader, told investors it expects earnings before interest and taxes of as much as $2.6 billion in 2015 from its trading unit.
The Mexican government paid $773 million last year to lock in prices, the government said last year. The annual Mexican hedge, which is closely watched by the oil market and often moves prices, is probably the largest undertaken by a national government, the chief economist for the country’s Finance Ministry said in 2012.
While in 2009 the price of the Mexican oil basket, which serves as a benchmark for the hedge, recovered through the year, this time it has weakened as time went on and therefore would trigger a larger payout.

‘Good Move’

"2015 could have been a much worse year for the government if they hadn’t hedged it," said Joydeep Mukherji, managing director at Standard & Poor’s in New York. "This was a very good move from the risk management perspective to lock in a higher price than they would have gotten just on a spot basis."
Mexico used Citigroup, Goldman Sachs, JPMorgan, Morgan Stanley, BNP Paribas SA, Barclays Plc and HSBC Holdings Plc to implement its 2015 hedge, the central bank said in June following a public-information request by Bloomberg. The banks typically also hedge themselves in the futures market.
The windfall will be a boost for Luis Videgaray, Mexico’s finance minister. This year, Mexico completed its hedge for 2016 in August rather than in November as usual, in an apparent effort to lock in higher prices.
Few other commodity-rich countries have followed suit with similar hedging programs. Ecuador locked in oil sales in 1993 and, after losses triggered a political storm, nation never tried it again. Colombia, Algeria and even Texas have experimented with locking in prices. More recently, oil importers Morocco and Jamaica have hedged against rising energy prices, while Ghana, the world’s second-largest exporter of cocoa, hedges the price of beans.