About Me

My photo
An Investor and counsellor in Financial Market

Thursday, December 31, 2015

The World's Richest People Got Poorer this year

The richest people on Earth became a bit poorer this year.
The world’s 400 wealthiest individuals shed $19 billion in 2015, according to the Bloomberg Billionaires Index. Falling commodities prices and signs of a slower-growing China spooked investors around the world leading to the first annual decline for the daily wealth index since its 2012 debut.Income Inequality
"After three great years, 2015 stock markets worry-wiggled sideways," said billionaire Ken Fisher, the founder of Fisher Investments that manages more than $65 billion. "Fears over an oil glut, soft consumer spending and China breaking like a plate and taking commodities with it saw investors take fright."
Mexican telecommunications mogul Carlos Slim was the biggest decliner on the index at the close of trading in New York on Dec. 28, as his America Movil SAB dropped 25 percent in 2015. The world’s richest person in May 2013, Slim fell to No. 5 this year after losing almost $20 billion as regulators ratcheted up efforts to break apart the business that controls the majority of Mexico’s landlines and mobile phones.

Gates, Buffett

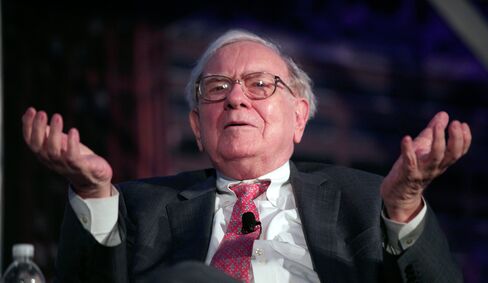
U.S. investor Warren Buffett, the world’s third-richest person, lost $11.3 billion as Berkshire Hathaway Inc. had its first negative annual return since 2011. Microsoft Corp. co-founder Bill Gates, the world’s richest person since May 2013, fell by $3 billion during the year.
Warren Buffett
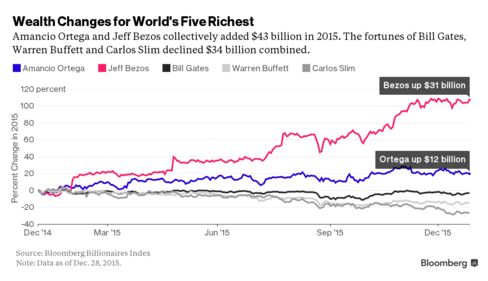
Gates’s losses and the continued rise of Inditex SA, the world’s largest fashion retailer, lifted Spain’s Amancio Ortega within about $10 billion of the top slot. Ortega, Europe’s richest person since June 2012, leapfrogged Slim and Buffett as he rose $12.1 billion to $73.2 billion.
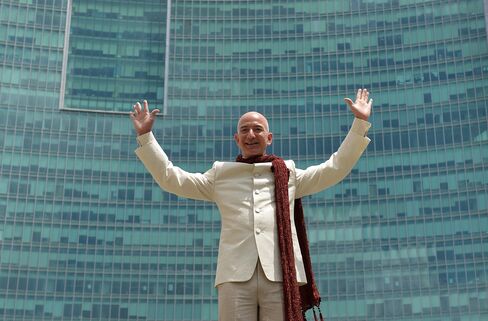
His 20 percent rise was still $19 billion short of the increase for the year’s top-gainer, Amazon.com Inc. founder Jeff Bezos. The New Mexico-born billionaire more than doubled his fortune to $59 billion as investors cheered profits at the world’s largest online retailer. Bezos added $31 billion in 2015, undoing the $7.4 billion decline he had in 2014 and propelling him up 16 positions to No. 4 on the index.
The shifts at the top came as global stock markets swung from early-year increases to sharp declines in the later months, with the MSCI ACWI Index falling 3.8 percent by the end of trading on Dec. 28.

Wild Swings

The world’s 400 richest people control a combined $3.9 trillion, according to the index, more than the GDP of every country on Earth except for the U.S., China and Japan. At their peak on May 18, the billionaires had almost $4.3 trillion, a $267 billion increase from Jan. 1. In August they lost those gains and more when a global sell off claimed as much as $182 billion in a week.
Jeff Bezos
Bezos and Ortega dominated the upside of the year’s gyrations, adding $43 billion between them. The performance of the two billionaires contrasted with the family that owns about half of Wal-Mart Stores Inc., the world’s largest retailer. The five members of the Walton family lost a combined $35 billion in 2015.
The market declines knocked 49 billionaires off the daily ranking this year, including Glencore Plc. chief executive Ivan Glasenberg and Wang Jing, a Chinese telecom entrepreneur who personally invested $500 million to help Nicaragua build an alternative to the Panama Canal. Glasenberg lost two-thirds of his fortune as he raced to slash debt at the Swiss commodities company and Wang fell by about 86 percent this year.

Brazilian Corruption

Brazilian banking billionaire Andre Esteves, former head of Latin America’s largest independent investment bank who was last ranked by the index in 2014, fell even further this year when his fortune declined by $1.5 billion. Esteves was hauled off to jail by police in November for allegedly trying to interfere in a corruption investigation.
After his arrest, he stepped down as Banco BTG Pactual SA’s chairman and CEO and the stock plunged by almost half. His fortune, which peaked at $4.9 billion in September 2014, ended the year at $1.8 billion. His lawyers said in December that the billionaire was arrested solely because he’s rich. He was released after the country’s supreme court ended the imprisonment after three weeks and remains under house arrest.
Andre Esteves
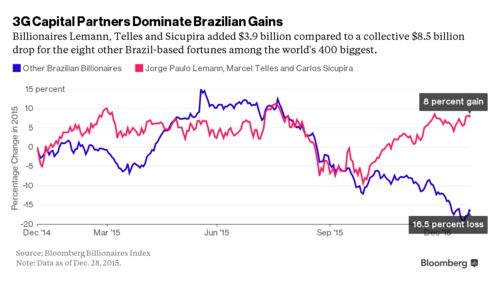
Esteves is the latest to fall in the biggest corruption investigation in Brazil’s history as the government cracks down on graft among the country’s economic elite. The probe, along with a political crisis, a currency rout and a recession took its toll, leaving only four of the 11 Brazil-based fortunes on the index with gains in 2015.
Jorge Paulo Lemann, the co-founder of New York-based buyout firm 3G Capital and Brazil’s richest person, led the gains with a $2.2 billion jump. His partners Marcel Telles and Carlos Sicupira increased their fortunes by about $1.7 billion combined, as 3G joined forces with Warren Buffett to merge Kraft Foods Group with H.J. Heinz. The three billionaires are also key shareholders in Anheuser-Busch InBev NV, the beer giant that agreed to buy to acquire SABMiller Plc in a $110 billion deal.
Wild Ride
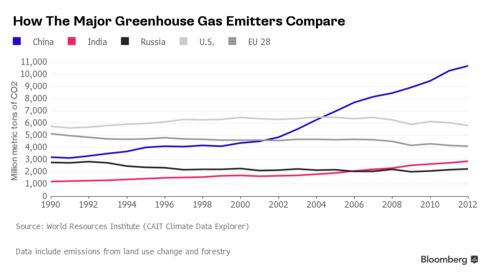
China’s billionaires had the wildest ride in 2015. On Jan. 1, there were 23 Chinese billionaires on the index with a combined net worth of $205 billion. At their May 27 peak there were 31 with a combined $348 billion. On Dec. 28 there were 28 billionaires with $256 billion.
As markets there surged, China became a veritable billionaire factory, with more than 50 new billionaires minted in the first half of the year. By July, the bubble had burst. Out of the 50 billionaires created in the first half of the year, only 19 remained billionaires in August.
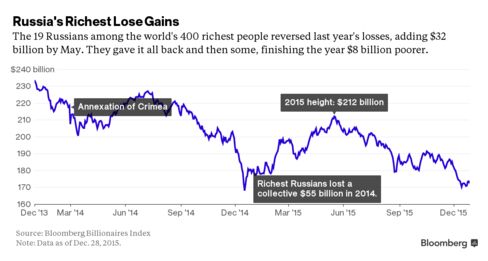
Russia’s wealthiest continued to experience their own tumult. The country’s richest people lost $55 billion in 2014 after the West imposed sanctions in the wake of President Vladimir Putin’s annexation of eastern Ukraine.
Oil Plunge
This year, plunging oil prices and the enduring chill of sanctions contributed to the country’s first economic contraction in six years. There were 19 Russians on the 400 on Dec. 28 who lost $8 billion during the year. The group was on track to claw back their 2014 losses until June, when the price of oil -- Russia’s biggest export -- began to dive.
Technology was the best-performing industry for billionaires in 2015. The 44 technology billionaires added $81 billion to their total net worth, led by Bezos’s $31 billion rise. Facebook Inc. CEO Mark Zuckerberg became $12 billion wealthier as the social network embarked on a renewed mobile advertising push and its vast audience grew even bigger. Strong ad sales also boosted the fortunes of Sergey Brin and Larry Page, the co-founders of Google parent, Alphabet Inc. They gained a combined $20 billion.

Commodities Rout

The 31 metals, mining and energy billionaires on the index were hit hard as a collapse in prices for oil copper, iron ore and other natural resources shaved $32 billion from their fortunes. Australia’s richest person, Gina Rinehart, lost more than a quarter of her wealth as iron ore plunged by almost half. Rinehart started shipping iron ore from her $10 billion Roy Hill mine this month, boosting global supply which some analysts say could contribute to a further slide in price. She’s the world’s 10th-richest woman with almost $10 billion.
In Nigeria, where tumbling oil prices caused slower growth and the Nigerian Stock Exchange All Share Index dropped 22 percent, Africa’s richest man, Aliko Dangote, suffered his second-straight year of losses. The owner of the continent’s biggest cement producer, Dangote now has $14 billion, about half what he had at his peak in January 2014.
The billionaires cited either declined to comment or didn’t respond to calls and e-mails requesting comment.

Hidden Billions

The Bloomberg index uncovered 115 new or little-known billionaires in 2015. In November, Wal-Mart heiress Christy Walton lost her title as America’s second richest woman after recently-unsealed court documents revealed that her late husband, John T. Walton, gave a third of his Wal-Mart shares to their son, Lukas. At 29, he’s the 92nd-richest person in the world with $11 billion.
Jamie Dimon
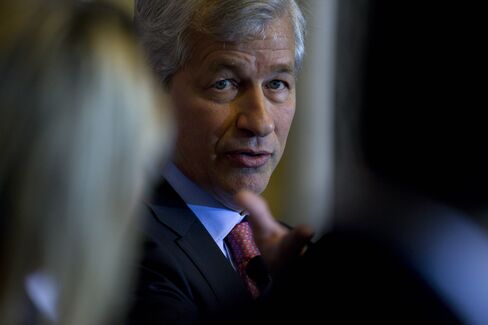
Elsewhere in the U.S., the rise of dominant investment banks, Goldman Sachs Group Inc. and JPMorgan Chase & Co. made billionaires of their respective chairmen, Lloyd Blankfein and Jamie Dimon, both of them rare instances of hired managers accumulating extraordinary wealth. The October initial public offering of iconic supercar-maker Ferrari NV cemented the billion-dollar fortune of second-generation heir, Piero Ferrari.
In Hong Kong, Yeung Kin-man has amassed a $10 billion net worth through Biel Crystal Manufactory, one of the biggest makers of glass covers for iPhones and other smartphones. Yeung’s rise came on the heels of the March initial public offering for Biel competitor Lens Technology Co. Ltd. that made Zhou Qunfei China’s richest woman. Zhou’s fortune increased more than $5 billion to $7.9 billion this year, a rise of 254 percent, the largest on the index.
As turbulent as 2015 may have been, 2016 may be even more so, according to Larry Adam, chief investment officer for Wealth Management Americas at Deutsche Bank AG.
"We’re going to see a lot more volatility than we’ve seen over the past couple of years,"said Adam, who sees emerging-market currencies and uncertainty around the U.S. election among the major market risks. "Much more muted performance and much more volatility. Caution is warranted."

Nifty...


Buy Nifty @ 7875
Stoploss 7810

Wednesday, December 30, 2015

These Are the Three Reasons Why U.S. Oil Production Hasn’t Declined… Yet

As we approach the end of what has been a miserable year for the price of crude oil, analysts are now directing attention toward indications of a floor forming.
Over 2015, a persistent surplus in production has offset significant cuts in forward capital commitments and a decrease in drilling – the number of drills in the field is now less than one third of what it was when the slide began last year.
But U.S. oil production has remained high, despite a clear contraction in operations. This is perhaps the least understood event of the past year.
There were essentially three reasons why this occurred… and they explain the next phase in oil markets…

Front-Loaded Wells Make Pumping Oil Worthwhile at Almost Any Price

First, as the brunt of American output moved from traditional drilling to emphasize unconventional shale and tight oil, drilling became deeper, horizontal, fracked, and much more expensive.
Yes, future projects in this class were the initial ones shelved. With prices diving below $50 a barrel and then below $40, wells requiring $70+ oil prices became untenable – especially once the price collapse gave notice that it was hanging around for a while.
Nonetheless, there was a double early premium from the more expensive drilling. For one thing, these deeper horizontal drillings produce more volume on average than standard vertical wells. For another, most of that volume comes out up front, usually within the first eighteen months.
Since over 80% of project expenses are front-loaded, with costs expended before anything comes out of the ground, operators will maintain initial runs at wells once open regardless of wellhead price (what they receive when the oil is sold to a distributor, usually at least 15% below what the market charges).
That is the only way to recover sunk costs.
In higher priced scenarios, a producer will use secondary or enhanced oil recovery (SOR/EOR) techniques to lessen the normal production decline. These include water flooding, natural gas reinjection, and chemical treatments.
The problem here is that for already expensive shale/tight oil drilling projects these SOR/EOR techniques drive costs up even further. In the current environment, most companies will forego these ways of increasing volume and rely on “creaming” initial production and then allowing the well to decline naturally. That downward curve can be rather steep.
Therefore, the initial pop in production from shale/tight wells is unsustainable when the same number of new wells are not being spudded to replace old ones.
In other words, we are in the initial stages of a U.S. production decline now expected by both domestic and OPEC analysts. There will be a short-term increase in prices as a result, until a balance is struck and new projects are undertaken.
But there’s another reason why U.S. oil production remained high throughout the year…

New Techniques Have Increased Drilling Efficiency

The second factor leading to higher production despite the decline in both capital commitment and rigs involves improvements in drilling efficiency.
Simply put, the last year has witnessed some refinements in both technique and operations that have reduced per-well costs appreciably. This allows drilling to continue in marginally profitable locations, even though the longer-term prospects show little marked improvement.
Still, most companies have been staying above water (or one step ahead of the sheriff) by hedging prices forward. Unfortunately, that approach is no longer viable: spreads are not sufficient to allow cash-poor operators sufficient leverage, and the debt crunch is hitting.
Simply put, even with lower per-well costs, companies cannot roll debt over at rates allowing them to stay in business.
These considerations are accentuated by the realization that the vast majority of producers have been cash poor for more than a decade. This means that they have been spending more on ongoing and new projects than they’ve obtained from sales from existing production.
Normally, when prices are higher, this is of little consequence. Cash on hand can be used for dividends, stock buybacks, or asset replacement while the expected oil market price provides debt at affordable rates. The interest merely becomes a cost of doing business.
Today, however, it is combining with other factors to bring about a wave of corporate bankruptcies, insolvencies, mergers, and acquisitions.
In the meantime, another technological advance in oil drilling has proven to be more of a double-edged sword…

Cheaper Wells Have Propped Up Production… for Now

Third, the present state of oil in the U.S. is emphasizing what I call VSF projects – vertical, shallow, formula drilling. These are wells that provide major cost advantages over unconventional, deep, horizontal, fracked drilling.
For example, while a deep well in the Eagle Basin or Bakken can easily cost $5-6 million or more, a VSF well can cost no more than a few hundred thousand dollars.
The comparative expense advantage is obvious. But these wells also produce less. Therefore, VSF may be a life preserver for some companies, but it is not going to make up the slack lost in aggregate production levels.
The bottom line is this. All three of these factors are leading to a plateauing of U.S. production, registered by fewer companies…and some pressure for rising prices.
And that brings us to the next phase in oil markets…

U.S Oil Producers are Well-Positioned for Next Year

Remember, while the talking heads have been fixated on supply levels acting as a suppressing element on the price of oil, the other side of the equation is not declining. Instead, overall demand continues to increase, with the primary spikes occurring globally in regions providing higher prices.
This is another tailor-made support for Congress at last allowing exports of U.S. crude. The lifting of the export ban remains the best mid-term protection for domestic jobs and local tax bases.
On a related note, WTI (West Texas Intermediate, the New York benchmark oil rate) is now trading at parity to London-set Dated Brent. That is reversing a five year trend and provides for a marginally higher WTI market price.
Now, don’t get me wrong here. We are not moving back toward $80 or $90 a barrel. The recovery will be slow and stochastic. Yet it is shortly to be underway.

Nifty..


Buy Nifty @ 7905-7865
Stoploss 7810

Tuesday, December 29, 2015

Big Oil, Make Way for Big Solar. The Winners and Losers in Paris.

  • Ambitious climate pact means long-term economic transformation
  • If you don't adapt, `your livelihood is going to be destroyed'

Saving the world isn’t going to be cheap. If you sell oil, coal or old-fashioned cars, that threatens disaster. For makers of stuff like solar panels, high-tech home insulation, and efficient lighting, it’s a potential miracle.
That’s the bottom line from this weekend’s climate deal in Paris, which commits 195 countries to reducing pollution in order to head off dangerous climate change.
Global governments and companies are counting the costs and benefits from the agreement, which calls for wholesale transformations of energy, transportation, and dozens of other lines of business. Fossil-fuel producers and countries that depend on them face massive, costly disruption. Players in up-and-coming industries like renewable power and energy efficiency are looking at an unprecedented opportunity.
“As a major oil and gas company, we are clearly at stake in these discussions," Patrick Pouyanne, the chief executive officer of French oil giant Total SA, said in Paris. But "an optimist sees in every difficulty an opportunity. I’m definitely an optimist; I have to be."
The Paris pact, which also calls for a review of ever-tightening pledges every five years, is the most significant global climate agreement ever, outstripping the 1997 Kyoto Accord in its scope and ambition. Along with Barack Obama, Vladimir Putin, Xi Jinping and dozens of other top political leaders, the summit that produced it attracted hundreds of large companies eager to influence or understand negotiations that could deeply affect their future business models.
The deal will likely accelerate investments in technologies like renewable energy and electric vehicles -- especially if more countries join the European Union and parts of North America in imposing a price or tax on carbon. The United Nations estimates upward of $1 trillion a year in spending is required to de-carbonize the global economy and prevent temperature rises scientists say could flood coastal cities, disrupt agriculture, and destroy ecosystems.
That means companies with business models threatened by a low-carbon world need to re-focus, and fast, said Lyndon Rive, CEO of SolarCity Corp., a U.S. provider of home-solar systems chaired by billionaire Elon Musk. For people who sell oil, Rive said on the sidelines of the Paris summit, "you’re going to defend that job because that’s your livelihood. But your livelihood is going to be destroyed."
Executives from more traditional companies have a similar, if less stark, view. Peter Terium, CEO of German utility RWE AG, said companies like his would have to learn from the successive transformations of International Business Machines Corp. to stay relevant in a new energy system. RWE on Friday approved a plan to split into two companies, one focused on renewables and grids and the other managing declining conventional assets.
That doesn’t mean Big Oil will be closing up shop anytime soon. According to a relatively optimistic forecast of emissions cuts by the International Energy Agency, fossil fuels will still account for about 75 percent of energy demand in 2030, with coal hitting a plateau, oil growing slightly and natural gas surging.
New installations of clean energy from 2004-2014.
To stay ahead of climate policies, energy majors are placing their heaviest bets on gas. While solar is advancing quickly in terms of cost and efficiency, the industry hasn’t yet figured out how to stockpile sufficient power for times that the sun isn’t shining. Until that problem is solved -- likely with major improvements in batteries -- there will be significant demand for coal, gas, or nuclear power.
"Gas is one of the most compelling opportunities in the short to medium term," Helge Lund, the CEO of British gas producer BG Group Plc, said in Paris. A world totally without fossil fuels is "beyond the meaningful planning horizon," leaving companies like his plenty of time to keep drilling, he said.
Energy investment, though, will increasingly shift toward green power. Under another IEA scenario, renewables will attract about 59 percent of capital in the power sector over the next decade, rising to about two-thirds from 2026 to 2040. France’s Total, for example, is building out its solar business, shifting investment to gas, and expanding energy-efficiency services to cope.

Feeling Pain

Coal companies will be especially hard-hit. The Stowe Global Coal Index, which tracks the stock performance of 26 major producers, has lost 59 percent of its value this year. It’s the start of a shift of "many trillions of dollars toward low-carbon technologies and away from old fossil-fuel technologies," Mindy Lubber, CEO of Ceres, an organization that works with investors to push companies for better environmental performance, said in an e-mail.
While environmentalists and many politicians argue the overall transformation will be positive for economies and jobs, millions of workers will face severe consequences. In the Canadian province of Alberta, the heart of the country’s oil patch, a newly-elected left-of-center government last month raised carbon taxes sharply. The idea, Environment Minister Shannon Phillips said, is to use the proceeds to help "make those investments in clean tech, in efficiency, in the renewables space," and diversify the economy away from fossil fuels.
"Any transition has obviously not got everybody benefiting in equal amounts," creating a need for programs like job re-training, U.S. Energy Secretary Ernest Moniz said in Paris. "I’m not going to sugarcoat it."
Executives at companies that have moved early to get themselves ready for a lower-carbon world argue there’s nothing new about the energy transition except perhaps its scale; after all, changing technologies have been obliterating business models since at least the invention of the wheel.
"Really high-carbon industries have had their day," said Steve Howard, Chief Sustainability Officer at furniture retailer Ikea. "If they can adapt and reinvent themselves, fantastic! If they can’t, maybe some will just return cash to shareholders and slowly close up shop.

Nifty..


Buy Nifty @ 7880-7845
Stoploss 7810

Monday, December 28, 2015

Why Emerging Markets Will Rebound Next Year- By ARJEN VAN DIJKHUIZEN

ABN Amro expects headwinds to fade as commodity prices stabilize, trade picks up and China’s imports improve.


In late November, we published our Global economic outlook, Cautious optimism warranted. In the first chapter of this publication, our Chief economist Han de Jong explains that the global outlook for 2016 and beyond hinges on a couple of questions. A crucial one is whether emerging economies can deal with the challenges they have struggled with in 2015. His answer is a cautious ‘yes’, although he adds that the risks of a less favourable development than we are forecasting in our base case are relatively high. In this publication, we zoom in on developments in EMs and their prospects, the divergence between various regions/countries and the risks that could interfere with our base scenario of a modest economic recovery for EMs in 2016-17.
As headwinds intensify, EM growth drops significantly in 2015
2015 has been a tough year for EMs. On average, EMs are still growing faster than advanced economies, but the relative momentum has turned and EM growth is clearly below trend. EM growth has continued to fall since 2010, with a strong slowdown in 2015 (by 0.7 %-point, to 3.7%). This reflects several headwinds. First, the negative effects of the sharp drop in commodity prices on commodity exporters outweigh the positive windfall effects for net importers. Second, weak external demand from key trading partners (China as well as some advanced economies) has also affected non-commodity exports. Third, a deterioration in market sentiment versus EMs in the course of 2015 – relating to the China slowdown and Fed rate hike fears – triggered net portfolio outflows (particularly in the summer), contributing to a further tightening of financial conditions in EMs.
Divergence between regions and key EMs has increased
These headwinds have not impacted all EMs equally. Latin America, Russia, Central Asia, the Gulf region and Africa have been hardest hit by the drop in commodity prices. Domestic conditions vary as well: economic policies, the scope for stimulus, structural issues, political instability. All these factors help to explain the divergence between regions and countries. Growth in emerging Asia (around 6%) is slowing a bit, but remains relatively robust. While China is continuing a gradual slowdown, India is growing by ±7.5%, making it the fastest growing emerging giant. Regional growth in emerging Europe has fallen by around 2.5 %- points compared to 2014, to -1%. This is driven by Russia (-4%, due to lower oil prices and Western sanctions) and Ukraine (-10%), but Central Europe is doing well helped by the eurozone’s recovery. Latin American growth has fallen by 1.5%-point to around -0.5% this year. Here, the largest economy Brazil (our estimate for 2015 is -3%) was hit by a poisonous cocktail of low commodity prices, political turmoil, weak policies and structural issues.
In Q3-2015, EMs faced with largest capital outflows since global crisis
Risk sentiment for EMs deteriorated sharply in the course of 2015, reflecting China-related concerns, falling commodity prices and a looming Fed rate hike. Net portfolio outflows from EMs rose in the summer, contributing to a further tightening of financial conditions. IIF data show that in Q3-2015, net portfolio (equity and debt) outflows amounted to USD 33 bn. This exceeded the levels seen during both the taper tantrum in June 2013 and in late 2014. In October, capital flows to EMs partly returned, after dovish signals from G3 central banks. In November, however, EMs were faced with another wave of outflows (albeit at relatively low levels), driven by the stronger pricing in of a Fed lift-off in December 2015. For 2015 as a whole, EM net portfolio inflows are projected to be the weakest since 2008. The IMF estimates total net inflows in January-November 2015 at USD 44 bn, compared to an average net inflow of USD 270 bn in the period 2010-2014.
… explaining the sharp correction in EM asset prices and currencies
The reversal in capital flows in the course of 2015 has gone hand in hand with a sharp correction in EM currencies and stock markets. Our EM currency index dropped to record lows versus the USD, even surpassing the levels seen during the global crisis (chart). This partly reflected US dollar strength, bolstered by an improving US growth momentum and rising expectations of a Fed rate hike. Commodity currencies weakened the most versus the USD, including the Brazilian real, the Colombian peso, South African rand, the Malaysian Ringgit, and the Russian rouble. Meanwhile, the underperformance of EM stock markets versus those of advanced economies has widened further in 2015.
Weak global trade and lower demand from China add to headwinds
Weak global trade added to the EM’s headwinds in 2015. Global trade growth has declined in recent years, remaining relatively weak compared to global real GDP growth. This goes hand in hand with the slowdown in global industrial production. All this also translates into a disappointing EM export performance. Growth in EM export volumes fell to 1.1% yoy in January-September 2015, compared to 4.6% in 2013 and 2014. This slowdown was driven by emerging Asia, reflecting weak external demand from China but also from advanced economies like Japan. China’s merchandise imports fell by around 15% yoy so far in 2015, although this contraction is largely explained by the drop in import (including commodity) prices. We estimate that Chinese merchandise imports have contracted by around 5% in 2015 in volume terms.
We expect some EM headwinds to fade in 2016 …,
Going forward, we expect several of the headwinds that plagued EMs in 2015 to fade in 2016 (see also our Global economic outlook, Cautious optimism warranted):
1. Commodity prices. Commodity prices have been falling since 2011, but the pace accelerated in late 2014 and 2015. Many commodity markets continue to be plagued by excess supply. Lower than expected demand from China, disappointing global growth and the increased productive capacity in recent years have created an imbalance between supply and demand in many commodity markets that will take time to disappear. However, as we anticipate that investors’ net short positions will be (partly) closed and that high-cost producers will cut production, we believe commodity markets will have a less negative impact on EMs in 2016 than they did in 2015;
2. Global trade. Next year, we expect that global trade will benefit from a moderate pickup in global growth and a rebound in global industrial production and manufacturing.
3. China imports. We also foresee an improvement in China’s imports in 2016, as we expect the country’s slowdown to remain gradual and negative base effects to fade out.
… while currency depreciation will support external adjustment
Although the sharp depreciation of many EM currencies versus the US dollar poses inflation risks and raises debt service cost of USD-denominated debt, it also has beneficial effects.
Depreciation helps strengthen competitiveness, which supports exports, while simultaneously contributing to the squeezing of imports. This mechanism, which has already started working, leads to an adjustment of external imbalances. The chart below shows the current account for five EMs in our so-called fragile six: Brazil, Colombia, Indonesia, South Africa and Turkey (see our September publication, The top six EMs most at risk). The currencies of these countries have all depreciated relatively sharply versus the US dollar. In all cases, the current account deficit has started to come down in the course of 2015.
We expect emerging markets’ growth to modestly recover in 2016-17
Tighter credit conditions will remain a headwind, but EMs should benefit from fading headwinds (stabilisation of commodity prices, pick-up in global trade and fading import weakness in China) and currency depreciation, which will support external adjustment. All in all, we expect growth in EMs to stage a modest recovery (in line with global growth), from 3.7% in 2015 to 4.2% in 2016 and 4.6% in 2017. Still, divergence between regions/countries will remain high:

Emerging Markets: Economic growth forecasts
% yoy 201320142015* 2016* 2017*
Emerging Asia 6.56.36.165.8
- China 7.77.376.56
- India 6.97.37.57.57.5
Emerging Europe 1.71.3-11.72.4
- Russia 1.30.6-40.51.5
Latin America 2.41.2-0.40.42.4
- Brazil 2.70.2-3-21.5
Emerging markets 4.64.43.74.24.6
World 33.12.93.33.4
Source: ABN AMRO Group Economics.
* Forecasts for 2015-2017 are rounded
- Emerging Asia will continue to outperform other regions, but the gradual slowdown will continue, driven by China. India will still be Asia’s fastest growing giant. We see some room for improvement in export-oriented economies, as external demand should strengthen on the back of improving world trade.
- The outlook for emerging Europe has improved. Following a deep crisis, we expect Russia to grow modestly this year. The economies in Central Europe should continue to propel ahead, supported by the Eurozone’s continuing recovery. In the case of Turkey, there is not much scope for acceleration, given its external and political fragilities.
- We anticipate that Latin America will see a revival of exports, which will kick-start a cautious economic recovery in 2016. However, persistent structural problems and the impact of restrictive economic policies will continue to prevent an exuberant recovery.
Risks still clearly tilted to the downside
Still, we see a number of risk factors that could derail our base scenario of a modest economic recovery in emerging markets in 2016/2017.
1) Fed rate hikes. With the Fed lift-off expected in December, we expect 75 bps in additional rate hikes by the Fed in 2016. This could trigger a new wave of portfolio outflows, contributing to a further tightening of financial conditions in EMs. This risk could be even greater should the Fed hike faster than expected and/or if the lift-off would trigger a sharp increase in bond yields in advanced economies. For several EMs, this risk is mitigated by a large share of FDI in external financing (e.g. Brazil) or a sizeable stock of foreign exchange reserves (e.g. China, energy exporters).
2) High private debt levels ... There has been a rapid accumulation of private debt in EMs since the global financial crisis. This debt load is concentrated in emerging Asia and mainly driven by China, but other countries in Asia (e.g. Korea, Hong Kong, Singapore, Thailand, Malaysia) and elsewhere (e.g. Brazil, Chile, Turkey) also have high debt levels. Such high debt burdens could prove to be a drag on the economy, certainly in the case of rising interest rates, as they could depress domestic demand and may lead to repayment problems for borrowers and a deterioration of asset quality for banks.
3) … and high dollar debts. In the case of US dollar denominated debt, risks are exacerbated by the weakening of EM currencies versus the dollar. BIS data show that the level of USD denominated corporate debt in countries like Turkey, Russia, Mexico and Indonesia correspond to 10% of GDP or higher.
4) Hard landing China. Our base scenario assumes an ongoing gradual slowdown of China’s economy in 2016-17. Obviously, given the country’s relevance in the global economy, global trade and commodity markets, a faster-than-expected slowdown would pose a key risk to our EM outlook.
5) Global trade remains weak. Should global trade (including imports from China) continue to disappoint, this could jeopardise our projection of a pick-up in EM exports.
6) No stabilisation/rebound of commodity prices. Sustained excess supply in commodity markets and/or disappointment on the demand side could mean commodity prices stay lower for longer or fall even further. That would pose greater risks for commodity exporters.
7) Geopolitical risks. Our base scenario could be threatened by geopolitical risk factors, given the wide range of potential triggers: unrest in the Middle East, tensions between Russia and Ukraine/Turkey/NATO, political risks in Europe (rise of anti-establishment parties, Brexit, independence movements) and Latin America, conflicting claims in the South Chinese Sea etcetera.
In conclusion
In summary, in our base scenario we expect emerging markets to stage a modest recovery of GDP growth in 2016-17. However, against the background of the looming Fed rate hikes – the first in almost a decade –, high EM debt levels and ongoing uncertainty regarding China’s transition, we feel that risks are still clearly tilted to the downside. That said, there is also a small possibility of positive surprises coming from the EMs. These could stem, for instance, from a stronger-than-expected pick-up in global growth and EM exports or an overall improvement in risk sentiment benefiting commodity prices and EMs more generally