Upset that you missed the boat on the bitcoin craze last year?
Millionaires were minted overnight as bitcoin returned 1,700 percent in 2017, only to see prices crash by more than half since December. The bubble seems to have popped, and not everyone got out in time.
While we may be past the peak temporarily, the cryptocurrency trend is just getting started, and investor enthusiasm is still growing by the day.
(Click to enlarge)
While the bitcoin investment boat may have already set sail, it’s likely far from the last huge opportunity in the space. The cryptocurrency and blockchain market is expanding at a significant rate, and there is one unique and simple investment opportunity that could give investors access to a broad spectrum of the space.
The problem for would-be cryptocurrency investors is trying to figure out the next big thing. Now, a new Canadian investment company will figure that out for you, offering exposure to not just cryptocurrencies by also the entire blockchain ecosystem.
Global Blockchain Technologies Corp. (CSE: BLOC; OTC: BLKCF) is Canada’s first blockchain-focused investment company. Bitcoin captured the interest of the global financial industry last year, but it makes up just a fraction of the blockchain market. The recent collapse in bitcoin prices now has some investors nursing their losses and biding their time until the next big cryptocurrency coin emerges.
More importantly, the underlying blockchain technology is an even bigger story than mere crypto tokens.
Global Blockchain offers the best of both worlds. It offers investors exposure to a curated selection of cryptocurrencies, while also opening the door to investment in blockchain, before the next wave of money rolls into this booming market.
As investors search for profits amid the market disruption caused by cryptocurrencies, Global Blockchain plans to offer a unique solution. This comes in the form of a basket of holdings that:
• Definitively answers massive demand from investors
• Will be one of the first ways to find and gain exposure to a wide breadth of cryptocurrencies and blockchain companies
• Is packaged in a publicly listed security accessible in the U.S., Canada and Europe, with Asia and Australia to follow
• Access to ICOs that investors would never be able to secure on their own
• Is led by major crypto-pioneers who are ready to make the crypto world a lot less cryptic
Here are 5 reasons to keep a close eye on Global Blockchain (CSE: BLOC; OTC: BLKCF), an investment company hoping to become the first-ever vertically integrated originator and manager of startup blockchains and investor in top-tier digital currencies:
1.) Blockchain To Impact Every Major Sector of the Global Economy
Blockchain is automation and collaboration on steroids, with market growth predictions headed into trillion-dollar territory. The technology is the backbone of the exploding crypto-currency market, worth a pretty $333 billion today.
There’s likely no industry that’s isolated from being disrupted by blockchain technology.
- Banking:Seven major global banks have partnered with fintech companies to develop new blockchain technologies, because blockchain and cryptocurrencies simplify so many things in the banking world, from fees for sending payments through middlemen, privacy threats, and security risks to cumbersome lending in the $134-trillion global banking industry.
- Global Logistics: Blockchain technology is already being used to track global trade and shipments in this $8-trillion-plus industry.
- Real Estate: This $7.4-trillion industry is also a major beneficiary of blockchain tech. Look no further than the real estate mecca of Dubai, which is putting its entire land registry on a blockchain.
- Healthcare: The global healthcare IT market, valued at $134 billion last year, is publicly seeking IT solutions from Blockchain.
- Crowdfunding: Even this $96-billion market is embracing blockchain.
And the list goes on …
“Blockchain solutions in finance are virtually endless … any centralized marketplace that is dominated by a few middlemen is likely to be taken over by blockchain technology,” says BLOC Chairman Steve Nerayoff. The opportunities are mind-boggling.
2.) BLOC Offers Exposure to Blockchain Ecosystem
Global Blockchain (CSE: BLOC; OTC: BLKCF) has plans to invest in a basket of holdings within the blockchain space, offering investors a slice of profits from the entire shift towards blockchain tech. This innovative strategy would make Global Blockchain the first global investment company with exposure to a wide cross-section of the blockchain ecosystem — all backed by startup equity and token diversification.
The investment strategy also benefits from diversification, lowering risk for investors by balancing more established companies with hand-picked, high-growth potential small-caps. Global Blockchain also plans to diversify portfolios by balancing cryptocurrencies by category.
You can buy it right now from an online broker, and even add it to your IRA or 401K.
(Click to enlarge)
Here are Global Blockchain’s planned investments:
But it’s not just about a basket of currencies to speculate on; it’s about the potential of building an investment portfolio based on the token economy — one of the first of its kind.
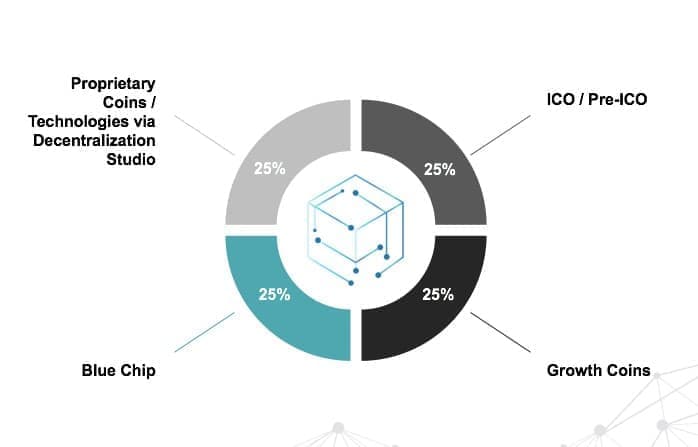
Here is Global Blockchain’s projected Asset Allocation:
(Click to enlarge)
3.) BLOC Led by Cryptocurrency Pioneers
The team behind Global Blockchain (CSE: BLOC; OTC: BLKCF) isn’t comprised of a bunch of financiers new to cryptocurrencies.
Remember the Ethereum ICO? It’s risen over 220,000 percent. Global Blockchain’s Chairman and CEO, Steve Nerayoff, was not only a senior advisor to Ethereum leading up to its ICO, but was the architect of the Ethereum crowdsale, the way the project was funded. He also was a senior advisor to the Lisk Cryptocurrency project, which now has a $1.8-billion market cap. Nerayoff is an early leader of the blockchain industry, and one of its most important pioneers.
But Global Blockchain’s knowledge base doesn’t stop with Nerayoff.
• Rik Willard: Cryptocurrency and ICO veteran, co-founder of the Silicon Valley Blockchain Society, and an advisor to Luxembourg and other countries’ blockchain initiatives.
• Shidan Gouran: Cryptocurrency and ICO expert with a long track record.
• Kyle Kemper: Executive director of the Blockchain Association of Canada.
• Jeff Pulver: Has consulted and invested in 350 startups.
• Michael Terpin: Co-founder of BitAngels, the world’s first angel network for digital currency startups. Managing partner of bCommerce Labs, the world’s first blockchain incubator fund. Founded Marketwire, one of the largest company newswires, which was acquired in 2006 by NASDAQ for $200 million.
And it’s not just their blockchain successes and expertise that investors will harness — it’s also their exclusive access to assets that investors would have difficulty investing in otherwise.
4.) Just The Beginning
If and when the U.S. Securities and Exchange Commission (SEC) approves crypto ETFs for listing on public markets, digital currencies will likely push even higher. Some projections show that as much as $300 million could pour into a bitcoin ETF in its first week, Bloomberg reports.
We’re looking at a potential total current market cap of tokens at $34 billion, and more than $2 billion has already flowed into ICO (initial coin offering) token sales. This is where Global Blockchain (CSE: BLOC; OTC: BLKCF) comes into play, with their expertise to make knowledge-based decisions on which ICOs may have what it takes to be winners, and how to play the futures. They also intend to balance large-cap holdings with small-cap and emerging cryptocurrencies so investors can benefit from the relative stability of one and the growth potential of the other at the same time.
Global Blockchain plans to become an incubator for new crypto technologies, which means that investors are not just investing in assets — they’re investing in innovation.
5.) Global Blockchain Cryptocurrency Incubator
Global Blockchain (CSE: BLOC; OTC: BLKCF) also plans to create additional value with its own incubator for new tokens, taking advantage of a major gap in the token world.
Most new ICOs have poor execution after they are developed. This is where Global Blockchain sees an opportunity. They won’t just help new blockchain companies build; they’ll help brand and distribute, taking equity stakes in the cryptocurrency in return.
While the major cryptocurrencies garner the most attention, sometimes the smaller tokens offer vastly more upside. Verge, for instance, with a market cap of $640 million, has offered a return on investment in excess of 200,000 percent. DigitalNote, a small token with a market cap of just $97 million, have offered investors a return on investment higher than 13,000 percent.
Global Blockchain will find and incubate upstart cryptocurrencies so you won’t have to try to discover them yourself.
Guided by a team with extensive real-world experience and backed by the world’s top blockchain programmers, this venture holds great promise as the next phase of maturity in an industry that lacks development. With Global Blockchain providing investors access to a basket of holdings within the blockchain space, and managed by a team of industry early adopters and pioneers, investors have a chance to access a market of huge proportions, since blockchain is poised to affect every industry.
New waves of money continue to enter the market, and the next wave could be Wall Street hedge funds. After that, possibly ETFs. And then everyone else. Getting ahead of the wave could be possible with Global Blockchain’s investment and incubator strategy.
The U.S. has been a net importer of energy since 1953, but that’s set to change early next decade, according to the Energy Information Administration (EIA). In its highly anticipated Annual Energy Outlook 2018, the agency forecasts that the U.S. will become a net exporter of energy by as early as 2022, thanks in large part to the boom in shale oil and liquefied natural gas (LNG) production as well as the relaxation of export restrictions. A “golden age of American energy dominance,” as President Donald Trump described it back in June, could be upon us sooner than anticipated, putting the U.S. on a path to dethrone Saudi Arabia and Russia as the world’s top oil powerhouse.
The 40-year-old ban restricting U.S. oil exports was lifted in December 2015, and between then and October 2017, exports skyrocketed nearly 300 percent.
This has galvanized shale producers into doubling their efforts to meet growing demand. Earlier in the month, I told you the U.S. produced more than 10 million barrels of oil per day in November for the first time since 1970. And in the week ended February 9, the number of active North American oil rigs rose sharply from 765 to 791, the most in nearly three years.
North America Expected to Drive Global Growth
The EIA’s forecast is in line with those of independent analysts, who see the U.S., along with Canada, dominating global growth in well demand.
“North American shale activity is the primary mechanism driving growth globally,” writes energy consulting firm Rystad Energy in its January global well market outlook. The group adds that the number of wells “completed in North America increased 40 percent in 2017, and we expect 11 percent average annual growth toward 2020.”
Sign of the Times: U.S. Import Terminal Preparing for First-Ever Exports
From Texas ports, the U.S. now exports crude to as many as 30 countries, seizing valuable market share from members of the Organization of Petroleum Exporting Countries (OPEC). Since November, China has become the largest consumer of U.S. crude other than Canada, according to Reuters. (Last year, in fact, China surpassed the U.S. to become the world’s largest overall importer of oil.) And in a surprising move that shows how the rise of American shale is reshaping the global market, the United Arab Emirates, a significant oil producer in its own right, purchased 700,000 barrels of oil from the U.S. in December, Bloomberg reports.
Now, for the first time ever, exports are set to be conducted from America’s only deepwater supertanker offloading terminal, the Louisiana Offshore Oil Port (LOOP). According to its website, LOOP has received more than 12 billion barrels of oil from foreign and domestic sources over the past three decades, but as an imports-only facility, it’s never been used to load an export cargo—until now.
If the trial run is successful, reports Bloomberg, “it will be a step change in America’s capacity to export the burgeoning production that’s roiled global oil markets.”
Oil Majors Reward Investors
All the extra oil supply might have some shareholders worried about lower prices and sinking profits, but for many major explorers and producers, profits have returned to the days when oil hovered above $100 a barrel. That’s the result, according to Bloomberg, “of CEOs’ focus on squeezing more from each dollar by stalling projects, renegotiating contracts and reducing the workforce.”
The opportunity for shareholders here lies in these companies maintaining or increasing their dividend payout while pledging share buybacks to offset shareholder dilution that occurred during the slump.
“The bosses of the world’s biggest oil companies are prioritizing investors over investments,” Bloomberg writes, “channeling the extra cash that comes from $60 crude into share buybacks and higher dividends.”
EBITDA's use as a measure of "clean" operating performance is questionable
EBITDA is often a bad proxy for cash flows
EBITDA is sometimes a dubious valuation metric
Anyone with even a basic exposure to the financial world will have at some point come across the term “EBITDA.” Despite not being officially recognized under GAAP, EBITDA (earnings before interest, tax, depreciation, and amortization) is one of the most widely used metrics in finance, particularly when it comes to valuation analysis and securities pricing analysis. By stripping away “non operational” expenses, EBITDA in theory allows for a cleaner analysis of the intrinsic profitability of a company. Since then, it has become so widespread that public companies have even begun reporting it in their earnings filings.
Given its extensive use, it may come as a surprise that EBITDA has several important critics. In fact, luminaries from the investment world such as Charlie Munger and Seth Klarman have publicly expressedstrong reservations about its use. Perhaps the most stinging critique comes from the “Sage of Omaha,” Warren Buffett himself. “When CEOs tout EBITDA as a valuation guide, wire them up for a polygraph test.” he proclaims. In Berkshire Hathaway’s 2000 shareholder letter, he went so far as to say: “When Charlie and I read reports…references to EBITDA make us shudder – does management think the tooth fairy pays for capital expenditures? We’re very suspicious of accounting methodology that is vague or unclear, since too often that means management wishes to hide something.”
The stinging criticism from such well-known investors may be unexpected to many readers. This article thus dives into the main reasons why EBITDA receives disapproval and looks at whether arguments in favor of curbing its popularity are merited.
Clean Operating Performance Metric?
The strongest argument in favor of using EBITDA is that it provides a clean metric of profitability without the impact of accounting policies, capital structure, and taxation regimes. It exclusively focuses on operating expenses, including the cost of services/goods sold, sales and marketing expenses, research and development, and general and administrative expenses. In summary, EBITDA is supposed to reflect the pure operating performance of any company.
Stripping out non-operating expenses can be useful for several reasons. For instance, in an M&A process, if the acquiring company would look to refinance the capital structure of the target company and change the capital expenditure plans, then it would want to use EBITDA to get an idea of what the earnings of the target entity would look like once the merger is executed. As Adams Price, managing director at The Forbes M&A Group, says, “[EBITDA serves as] a proxy for pre-tax operational cash flow. It gives a sense of what cash flows might be expected to come out of the business after an M&A transaction.”
Another reason for using EBITDA is that when comparing similar companies in different parts of the world, the effects of the different taxation and accounting systems can often muddy the waters. Tom Russo of Gardner Russo & Gardner delves into this: “It’s one thing to say in a U.S. context that you’ve looked at pre-tax earnings rather than EBITDA. But when you start to look at Heineken versus Cadbury Schweppes versus Budweiser, and if you don’t adjust for those non-cash charges — and one way to do it is using EBITDA — you have a more difficult time comparing across the market.”
With the above in mind, it would seems that EBITDA is an extremely useful metric. But then why the criticism? Most of the arguments against using EBITDA come down to the following fundamental question: does excluding interest, tax, depreciation, and amortization really provide a “truer” picture of the operating performance of a company? Let’s look at this in more detail.
Depreciation and Amortization
Working backwards, the first line items excluded from EBITDA are depreciation and amortization. Doing so could in many cases make sense. Depreciation and amortization are in fact non-cash expenses. So much so that the depreciation expense included in the income statement could be related to an expenditure incurred years ago. In fact, there are multiple ways with which to account for depreciation and amortization, and one’s choice of which method to use will have a significant impact on the reported earnings of a company. As Karen Berman and Joe Knight put it: “Depreciation and amortization are unique expenses. First, they are non-cash expenses — they are expenses related to assets that have already been purchased, so no cash is changing hands. Second, they are expenses that are subject to judgment or estimates — the charges are based on how long the underlying assets are projected to last, and are adjusted based on experience, projections, or, as some would argue, fraud.” That’s why excluding depreciation and amortization can in theory paint a more realistic picture of true operational performance.
However, is this always the case? Some argue not. For companies in capital-intensive sectors such as telecoms, for instance, depreciation and amortization is one of the major expenses and can’t be ignored as their capital expenditure form a major chunk of the cash outflow. Capex in the form of towers and network equipment are real expenses and depreciation and amortization are the annual charges the business is taking through its income statement. Another industry where using EBITDA could be misleading is the shipping industry, again a very capital intensive sector.
The fact that capex in some industries is intrinsically an operational expense and therefore should not be ignored is summarized nicely by Professor Chris Higson of London Business School:
“Used with care, EBITDA can be a useful way of isolating a certain subset of costs when comparing a group of similar companies. But too often it tends to be justified with the argument that, by omitting depreciation and amortisation, EBITDA represents a better measure of profit, one that better approximates cash flow. This is nonsense. Depreciation is a very real cost. It is the cost of consuming productive capacity. For some capital-intensive companies, depreciation is the largest cost they have. If we omit depreciation, we are not measuring income.”
Let’s look at a real world example: Sprint Corp, a telecommunication services provider. If we just take EBITDA to analyze the results of Sprint Corp in 2015-2017, we might conclude that it’s a great business with history of making large profits year after year (Table 1).
Table 1: Sprint Corporate EBITDA Summary
Year ending Mar. 31, $ millions
2015
2016
Revenues
34,532
32,180
Cost of Services and Products
(18,969)
(15,234)
SG&A and Other Operating Expenses
(12,109)
(9,548)
EBITDA
3,454
7,398
Source: Company filings
However, if we go further down the income statement and look at earnings before interest and taxes (EBIT) and therefore take into account the effect of depreciation and amortization, we arrive at a completely different conclusion. In fact, Sprint hardly seems to be making any money in the business, whereas its EBITDA runs into billions of dollars.
Table 2: Sprint Corp Detailed Financials
Year ending Mar. 31, $ millions
2015
2016
EBITDA
3,454
7,398
Depreciation and amortization
(5,349)
(7,088)
EBIT
(1,895)
310
Source: Company filings
Let’s look at another example: Liberty Global, an international telecommunications and television company. Below is a look at Liberty Global’s depreciation expense in comparison to its revenues. D&A expenses form c. 30% of the revenues! Clearly, this is not a cost that can be ignored when analyzing the company’s profitability.
Table 3: Liberty Global Depreciation Table
Year ending Dec. 31, $ millions
2013
2014
2015
2016
Revenues
144,74
18,248
18,280
20,009
D&A
4,276
5,500
5,826
5,801
D&A (as a % of Revenues)
29.5%
30.1%
31.9%
29.0%
Capex
2,482
2,684
2,500
2,644
Capex (as a % of Revenues)
17.1%
14.7%
13.7%
13.2%
Source: Company filings
Interest Expense
The second key line item that EBITDA excludes is interest expense. The logic for doing so is that in order to get to a better picture of operational profitability, interest expense should be excluded given that it depends on the capital structure, i.e., the mix of debt and equity used to finance the business.
But again, the question should be: Does excluding the effects of a company’s capital structure reallyprovide a truer picture of operational performance? No matter how small a business is, it is very common to use some amount of debt to finance the business. In capital-intensive industries including steel, oil and gas, and telecom, one would find debt amounting to tens of billions of dollars on a company’s balance sheet.
Consider US Steel, America’s leading steel producer, which generated approximately $1 billion EBITDA in 2011 but had operating cash flows of only $150 million in the same year. Depreciation and amortization expenses were about $700 million and interest expense was to the tune of $200 million in 2011. Given the nature of the business with regular capital expenditures on plants and machinery to maintain and expand operations, US Steel funded a meaningful portion of its approximately $850 million capital expenditure in 2011 through debt and related instruments. With this in mind, wouldn’t we consider interest expense an almost operational part of the business? Focusing only on EBITDA and ignoring interest expense would provide an incomplete analysis from a business perspective, especially when US Steel repeatedly funds necessary equipment maintenance and renewal through debt. By the way, as a result of depreciation and interest expenses, US Steel posted a loss in 2011 and EBITDA comprehensively failed to provide the whole picture.
Warren Buffett agrees, and in 2002, for instance, said that “people who use EBITDA are either trying to con you or they’re conning themselves. Telecoms, for example, spend every dime that’s coming in. Interest and taxes are real costs”
In the spirit of Buffett’s comment, let’s look at another real-world example from the telecom industry: Charter Communications (a cable and broadband services provider). We’ve already established above that capital expenditures are a necessary part of any telecom’s business operations. Importantly, Charter Communications funds its capital expenditure through debt. Logically, interest expense is thus a quasi-operational expense and cannot be ignored. With one bad year in 2008 where the business didn’t operate efficiently, it had to file for bankruptcy despite maintaining positive EBITDA.
Table 4: Charter Communications Financials
Year ending Dec. 31, $ millions
2005
2006
2007
2008
Revenues
5,033
5,504
6,002
6,479
EBITDA
1,747
1,721
1,876
696
EBITDA Margin (%)
34.7%
31.3%
31.3%
10.7%
Interest Expense
(1,818)
(1,877)
(1,851)
(1,903)
Interest as a % of EBITDA (%)
104.1%
109.1%
98.7%
273.4%
Net Profit
(1,003)
(1,586)
(1,616)
(2,451)
Source: Company filings
Taxation Expense
The last line item that EBITDA strips out is tax expense. Again, there could be good reasons to do so. Private equity funds, for instance, rely heavily on using EBITDA when evaluating businesses because it strips out the effect of taxation. The reason being that private equity buyers typically take on a large amount of debt to fund the acquisition, which reduces the equity capital they need to infuse to acquire the business. As a result, it leaves very little in taxable income after interest expenses have been paid to lenders. Minimal tax outgo is one of the reasons PE buyers are focused on EBITDA - Makes sense for PE but PE owns just a tiny fraction of businesses all over the world. Putting aside the case of PE, over last couple of years, tax inversion deals where companies were reincorporating outside US to take advantage of lower tax rates in other countries were fairly popular.
However, just as with depreciation and amortization and interest expenses, there are certain cases where stripping out tax expense does not provide a better picture of true operating performance. Consider a US defense contractor, there are several restrictions on the domicile of service provider and in some cases, the contracts are restricted exclusively for US incorporated businesses and hence, the company would be subject to federal and state tax laws if it has to continue to do business with the department of defense.
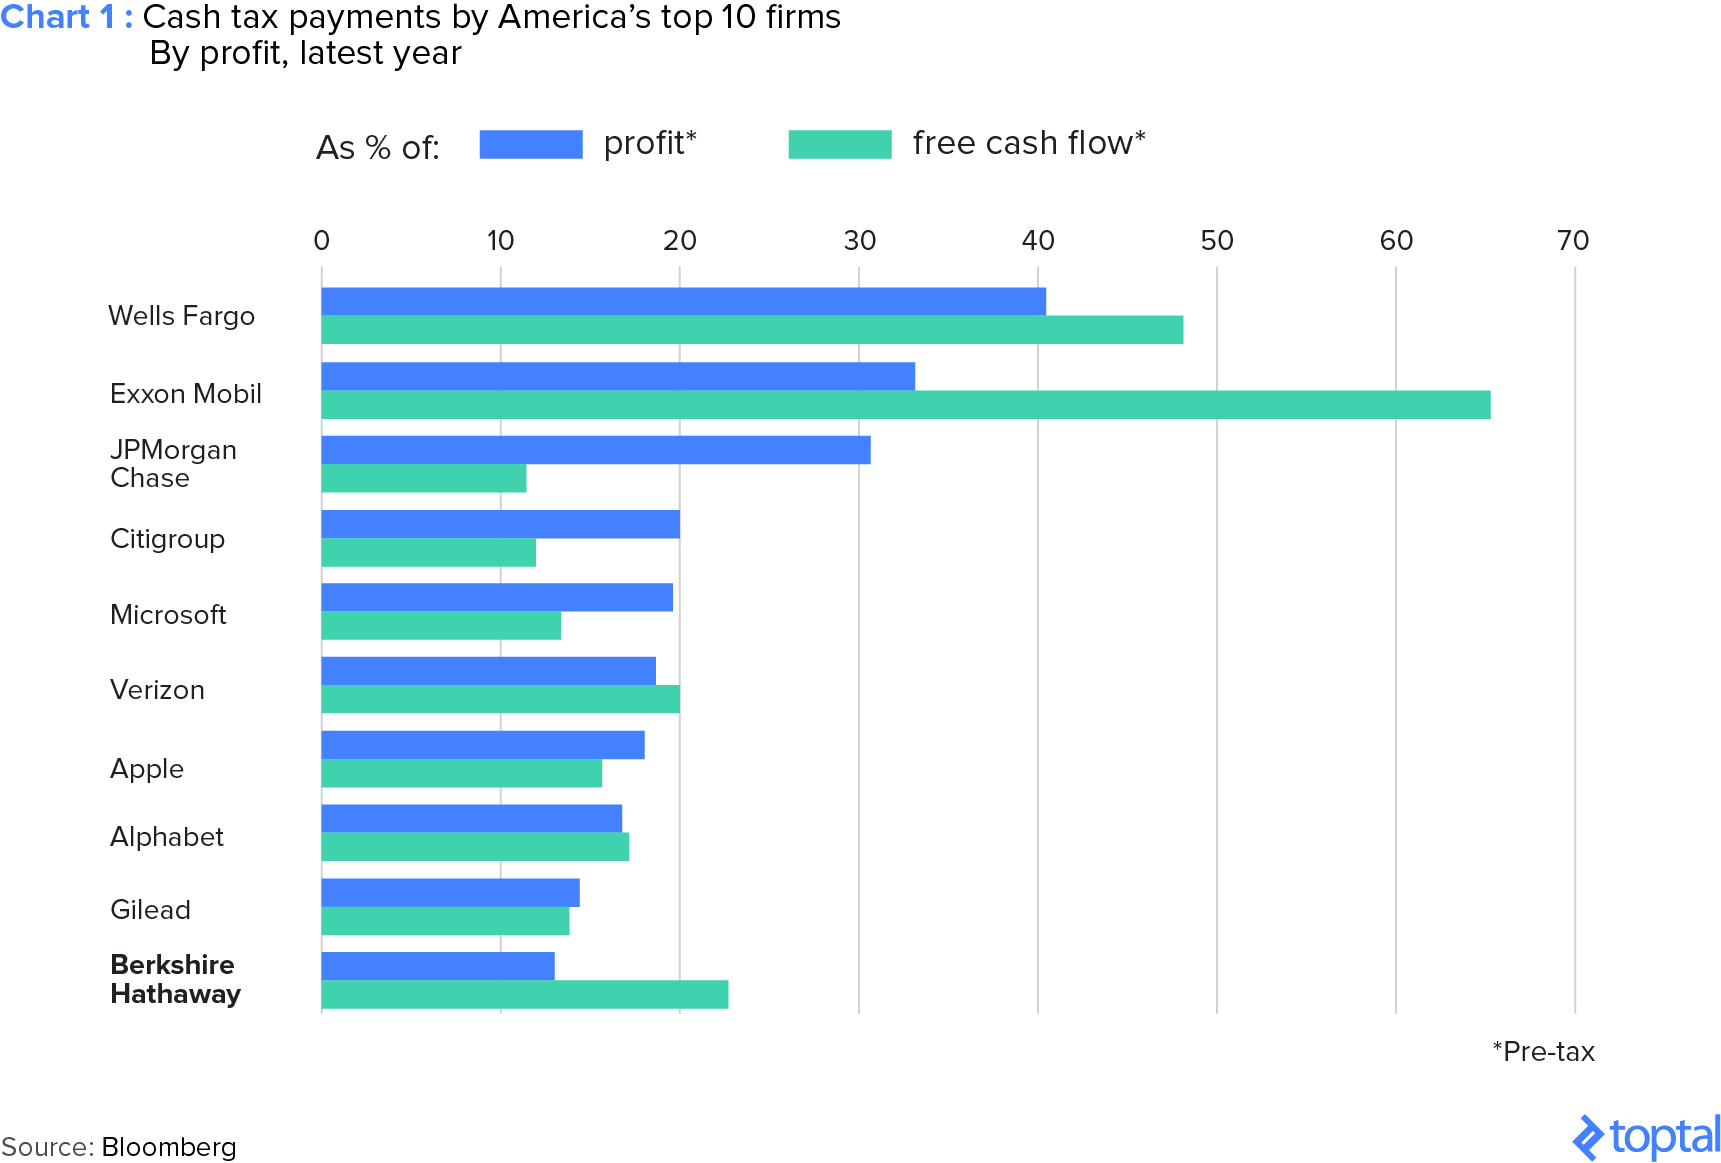
Though taxes are and will continue to remain a critical aspect while evaluating a business, it’s not a straightforward analysis given the complexity of the topic. Consider many large US headquartered international companies and you will find a large difference between applicable tax rates and cash tax payments. The difference is not only due to these companies holding cash in international jurisdictions (e.g., Ireland where taxes are lower than US), but research and development credits, carry-forward losses, operating leases, lower tax rates on capital gains, and other exemptions allowed under the tax code add up to make a significant difference between applicable tax rates and actual cash tax payments by the business. This also make a standardized approach to taxes difficult to implement and EBITDA takes the shortcut and very conveniently skips all of this.
The Emperor’s New Clothes
EBITDA was conceived of as a way to more clearly measure operational performance of a company by excluding expenses that can obscure the true performance of the business. However, as we have seen above, EBITDA can often achieve the opposite result. In some industries, the very expenses that EBITDA ignores are in fact operational expenses required in the day-to-day operations of the company.
Perhaps the most well-known example of the perils of using EBITDA relates to WorldCom. In the early 2000s, WorldCom was the second-largest long-distance telephone company in the US and the world’s largest carrier of internet traffic. But in 2002, the world shook as the company filed for what was at the time the largest bankruptcy filing in US history, and it was later revealed that several accounting malpractices had inflated the company’s total assets by around $11 billion.
Specifically, the WorldCom accounting scandals revealed the extent to which manipulation of EBITDA could be achieved. The often questionable nature of the metric which had for many years either been ignored or misunderstood was suddenly thrown into the limelight. As Daniel Gross of Slate recounted:
“[With EBITDA], it was thought, companies couldn’t mess with that number. Chief financial officers could routinely manage earnings by using the tremendous leeway that existed to account for certain items or take various charges. But EBITDA had far fewer moving parts, and there was far less discretion in accounting for items like operating expenses and revenues. And that’s why investors continued to trust in the validity of EBITDA numbers put out by companies like WorldCom, Qwest, and Global Crossing, even as their debts mounted and sales didn’t meet expectations.
In admitting that it had manipulated its EBITDA, WorldCom pinned the blame squarely on Chief Financial Officer Scott Sullivan, who was fired coincident with the company’s confession. Here’s how Sullivan is supposed to be responsible. In 2001 and part of 2002, the company, presumably under the direction of Sullivan, took $3.8 billion in costs related to building out its systems, which were usually filed as “line cost expenses,” and treated them instead as capital expenses. Remember, something that’s a capital expense—say the construction of a plant—creates an asset whose value can be depreciated over time. More significantly, it doesn’t count in the figures used in calculating EBITDA. By improperly recharacterizing those expenses—the maneuvers were done contrary to accepted accounting practices—WorldCom made it seem as if its EBITDA was $3.8 billion greater than it really was. This charade went on for five quarters, apparently undetected by WorldCom’s hapless accountant, Arthur Andersen”
A Good Cash Flow Proxy?
The other commonly touted reason for using EBITDA is that it’s a good cash flow proxy. This is particularly true for small businesses where most of the business is done on a cash basis and both revenues and operating expenses in the financial statements represent an almost complete picture of the business during a particular year. Think about standalone retail stores, restaurants, and even small B2B/B2C service providers with a short history of operations behind them and EBITDA in a particular year would approximate cash flows for the business reasonably accurately and these cash flows could then be used for capital expenditures, interest, and taxes, as the case may be.
Take the case of La-Z-Boy, the eponymous recliner company. In 2017, it was able to convert over 90% of its EBITDA into operating cash flows lending credence to the argument that EBITDA is a good proxy for cash flows. Nevertheless, if we go back to the 2015 and 2016 results of La-Z-Boy, it was able to convert a significantly lesser amount of EBITDA to its operating cash flows.
Table 5: La-Z-Boy Financials
Year ending Apr. 30, $m
2015
2016
2017
Revenues
1,425
1,525
1,520
EBITDA
125
149
160
EBITDA Margin (%)
8.8%
9.8%
10.5%
Operating Cash Flows
87
112
146
Operating Cash Flows as a % of EBITDA (%)
69.2%
75.5%
91.5%
Source: Company filings
Chris Higson of London Business School elaborates on this point:
“There is a view on the street as follows: ‘Cash flow measures are reliable because, unlike profit measures, they are not vulnerable to accounting. After all, taking the raw transactional data and pushing it around between periods using judgments about accruals is what accountants do. The cash flow statement simply undoes these accruals.’
A popular version of this view then says, ‘Depreciation and amortisation are pretty soft accounting numbers, so let’s add them and other long-term accruals back to EBIT to give us EBITDA, a hard number that will proxy cash flow.’
Unfortunately, the general view that cash flow is robust to accounting choices is, at best, only partly true and the specific view about EBITDA is wrong. Accrual accounting gets reversed at different points through the cash flow statement so, in general, cash flow statements get more robust to the effects of accounting policy choice the further down the page you go. For example, revenue anticipation is reversed in working capital investment, cost capitalisation is reversed in capex. EBITDA is at the top of the cash flow statement and it is the cash flow measure that is most vulnerable to accounting. Analysts developed an increasing enthusiasm for EBITDA in the late nineties, so flattering EBITDA became an easy option for a company in financial difficulties such as WorldCom.”
As Dr. Higson described above, the fact that EBITDA sits at the top of the cash flow statement by definition means that significant cash flow expenses are not included in its calculation. Businesses with high working capital requirements for instance would not see the effects of this reflected in their EBITDA figures. Using EBITDA as a proxy for cash flow is therefore highly questionable.
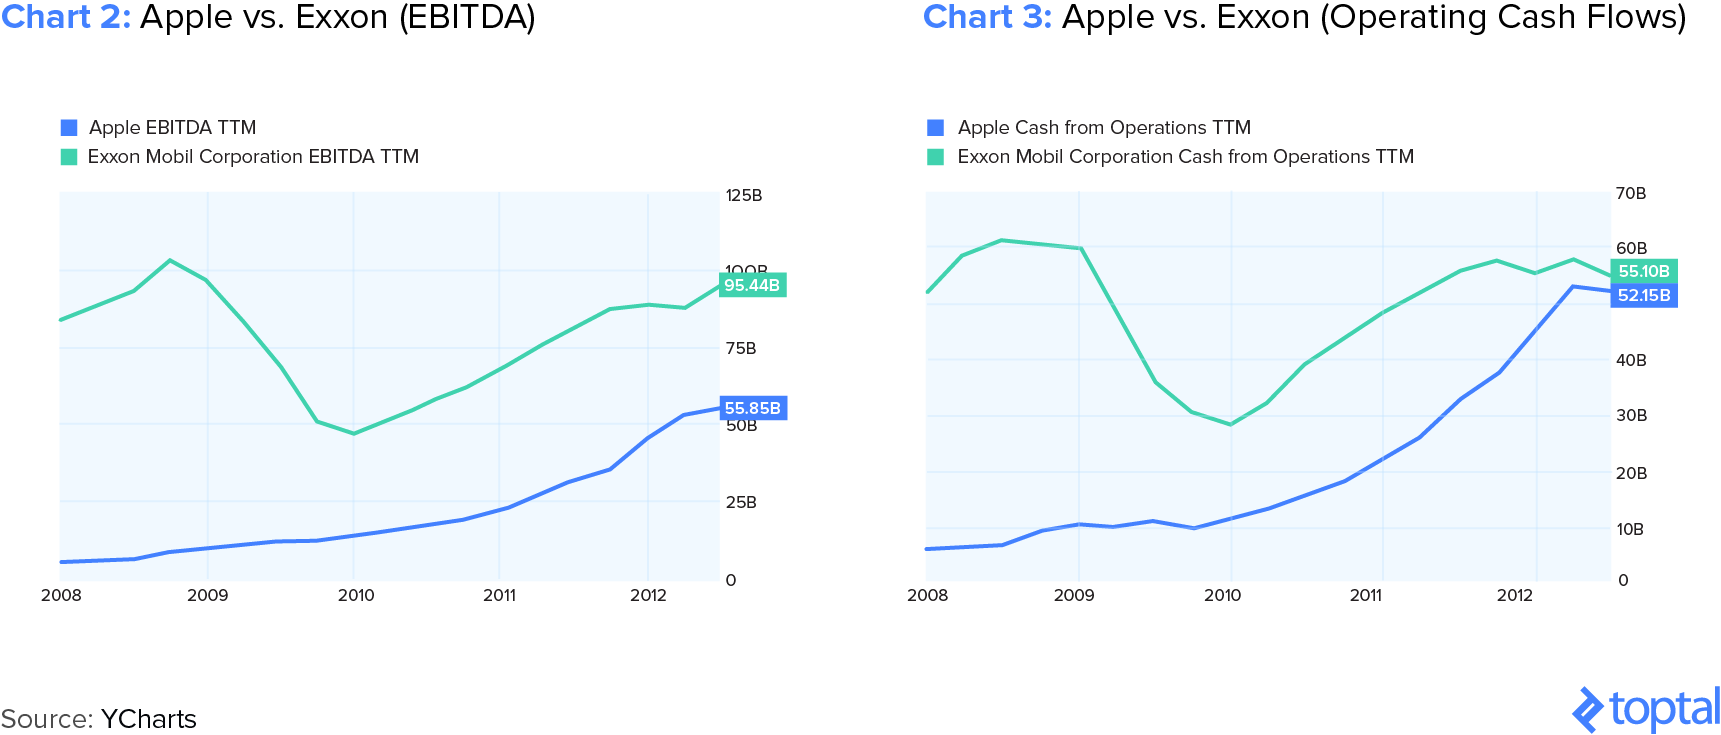
In another example, Let’s look at EBITDA and operating cash flows for Apple and Exxon. Not only is there a difference between EBITDA and operating cash flows for these businesses individually, there is a huge gap between the EBITDA of these companies ($56 billion vs. $95 billion) and the cash flow from operations ($52 billion vs. $55 billion), which are almost equal in June 2012. Moreover, the gap between EBITDA and operating cash flows for these businesses has been narrowing for a while which EBITDA fails to capture.
Returning to our previous example of Sprint, if we compare the EBITDA numbers with the free cash flow numbers, we can again see a hugely different picture.
Table 6: Sprint Corporate EBITDA Summary
Year ending Mar. 31, $ millions
2015
2016
Revenues
34,352
32,180
Cost of Services and Products
(18,969)
(15,234)
SG&A and Other Operating Expenses
(12,109)
(9,548)
EBITDA
3,454
7,398
Source: Company filings, YCharts
Table 7: Sprint Corporate Free Cash Flow
Year ending Mar. 31, $ millions
2015
2016
EBIT
(1,895)
310
Income Tax (expense) benefit
574
(141)
Depreciation & Amortization
5,349
7,088
Capex
(6,167)
(7,070)
Changes in Working Capital
(1,935)
(2,713)
Free Cash Flow
(4,074)
(2,526)
Source: Company filings, YCharts
Considering the above, we can conclude that although Sprint looked like a good business at the EBITDA level, it becomes a highly unsustainable business when we look at other profitability metrics such as EBIT, net income, and free cash flows—so much so that Sprint is currently on the verge of bankruptcy with c. $34 billion in debt.
EBITDA as a Valuation Metric
EBITDA is the most commonly used metric for valuation purposes. You can pick virtually any M&A announcement across any sector (with the exception of the financial services industry) and would find the mention of EBITDA as an underlying valuation metric for the business. In addition, all the transactions are evaluated largely on EBITDA basis.
“Restaurant Brands International would be paying top dollar to acquire Popeyes raised some eyebrows. At 21x EBITDA, the $1.8 billion transaction had the highest transaction multiple ever paid for a U.S. restaurant company. By comparison, when 3G acquired Burger King in 2010, the valuation was at 9x EV/EBITDA.”
“The EV paid by Air Liquide of $13.4 billion represents an EBITDA multiple of 14.4x, based on the adjusted EBITDA figure reported by Airgas in 2014 (c. $930 million), way higher than the 8.8x multiple that Air Products would have paid on Airgas’ 2010 adjusted EBITDA (c. $660 million).”
Qualcomm bought NXP Semiconductors for $38.5 billion and including the assumption of debt, the deal is worth $47 billion. NXP Semiconductors is valued at EV/EBITDA of 14.6x and EV/Revenues of 3.8x.
Seth Klarman has again called into question EBITDA’s use as a valuation metric. He believes that EBITDA might have been used as a valuation tool because no other valuation method could have justified the high takeover prices prevalent at the time (1980s). According to him, EBITDA overstates cash flow as it does not take into account all the non-cash gains and expenses along with working capital changes.
A research paper on Valuation Analysis at University of Oxford highlights the example of Twitter. In 2014, Twitter posted Adjusted EBITDA of ~$300 million and was valued at more than 40x EV / Adjusted EBITDA. Even though this valuation looked expensive, we could still convince ourselves of this valuation given high growth in revenues (more than 100% year on year) at that point in time - that’s exactly what Twitter did to investors. But if you go further down the Income Statement or the Cash Flow metrics to triangulate your valuation using a couple of other methods, the picture changes considerably. Not only does the business not generate any earnings or cash flows, the definition of Adjusted EBITDA used by Twitter is very questionable as it not only excludes depreciation and amortization, interest and taxes but also stock-based compensation. And in fact Twitter incurred more than $600 million in stock-based compensation expenses in 2014 which was more than 40% of its 2014 Revenues, but it asked potential investors to ignore that metric to arrive at its valuation.
Table 8: Twitter — Net Losses vs. Adjusted EBITDA
Net Income
FY2014 $576 million
Add: Depreciation & Amortization
208
Add: Stock-based Compensation
632
Add: Other Income Statement Items
40
Adjusted EBITDA
302
Change Working Capital
1,513
Capital Expenditures, net
224
Repayment of Debt
-0-
EV/EBITDA
42x
Increase (Decrease) in Conv. Debt
1.376
Cash Flow Conversion Rate
Negative
Price to Earnings
Negative
Price to Free Cash Flow
Negative
Source: Oxford University
Alternative Valuation Methodologies
After considering the above, we find that EBITDA faces considerable challenges in its application as an underlying valuation metric despite immense popularity. Difference of opinion is also strongest here for Buffett, Munger, and Klarman as they are looking to invest in businesses or buy them outright. Let’s follow their train of thought and visit some of the most common alternatives and apprise ourselves on their relative merits.
Table 9: Popular Valuation Methodologies
Highlights
Key Considerations
Enterprise Value ("EV")/Sales or Price/Sales
Used to value businesses with negative EBITDA and less susceptible to manipulation and accounting shenanigans
Can be used to calculate both enterprise and equity value of the business
Ignores profitability of the business which is the basis for valuation
Inaccurate in several cases, given the uncertainty on future profitability of loss making businesses
EV/EBITDA
Earnings and cash flows proxy for businesses
Values the enterprise independent of capital structure
Doesn’t take into account taxes, depreciation expenses, and capital expenditures
EV/EBIT (Earnings Before Interest and Taxes)
Earnings and cash flows proxy for businesses
Values the enterprise independent of capital structure
Doesn’t take into account taxes and capital expenditures
Depreciation subject to accounting policies could be prone to manipulation
Price/Earnings
One of the easiest metrics to value a business
Directly calculates the equity value for the business
Doesn’t accurately reflect the profitability of the business
Prone to manipulation given the impact of one-off expenses, accounting policies, and taxes
Price/Book
One of the easiest metrics to value a business
Directly calculates the equity value for the business
Doesn’t accurately reflect the profitability of the business
Infrequently used as a methodology in the current environment
Discounted Cash Flows (“DCF”)
Most comprehensive method to value a business
Can be used to calculate both enterprise and equity value of the business
Highly sensitive to terminal growth and cost of capital assumptions
Inaccurate in most cases given the length of the projection period
Source: Macabus, UBS
We can conclude from above that EBITDA is not the Holy Grail even though it’s as good if not better as some of the popular alternatives mentioned. But all this begs the question: “If not EBITDA, then what?” Unfortunately, there is no straight answer and we can see from above that all the metrics and methodologies have advantages and limitations. Most of the other popular valuation methodologies are fighting with similar issues as none of the methodologies except for DCF considers cash flows to the firm/equity owners (although DCF has its own set of issues with sensitivity to assumptions regarding the future of the firm).
Hence, the valuation methodology used would depend on the underlying business more than anything else. In addition, it could also depend on the type of buyer as well as the industry it operates in, among other things. Warren Buffett seems to have purchased See’s Candies and Nebraska Furniture Mart based on pre-tax earnings, as he was looking to add these to Berkshire Hathaway where taxes would be paid at Berkshire Hathaway level rather than at these acquired businesses. In industries like steel or oil and gas, investors and acquirers look to EV/Capacity, i.e., mt/barrels for respective industries.
Should EBITDA be Scrapped?
EBITDA is here to stay given its immense utility as a key financial metric. Ease of calculation, communication, and comparison gives it a lollapalooza effect, making its use self-perpetuating amongst financial analysts. However, the broader financial community needs to evolve from its current hedgehog mindset where they currently use EBITDA like a hammer and every business like a nail. We need to take a fox mindset and use EBITDA as one of the many tools to evaluate a business and become more aware of the nuances.
But with the above in mind, if EBITDA’s use should be reconsidered, what other metrics could we fall back on?
The answer according to Warren Buffett is Owner Earnings. A comprehensive explanation of Owner Earnings would require a separate article altogether, however simply put Owner Earnings are:
(a) Reported Earnings,plus
(b) depreciation, depletion, amortization and other non-cash charges, less
(c) average annual amount of capital expenditures for plant and equipment for business to maintain its competitive position and unit volume.
You can see shades of EBITDA in this. Let’s try to calculate this metric for Time Warner Cable, which was acquired by Charter Communications in 2016.
Table 10: Time Warner Cable Owner Earnings
Year ending Dec. 31, $ millions
2014
2015
Revenues
22,812
23,697
EBITDA
8,228
8,138
Net Income
2,031
1,844
Depreciation & Amortization
3,371
3,696
Other non-cash expenses
797
542
Total Capex
(4,097)
(4,446)
Maintenance Capex1
(2,480)
(2,752)
Owner’s Earnings
3,719
3,330
Source: Company filings
1. Maintenance Capex figure is subjective in nature. For TWC, we have approximated maintenance capex by comparing company’s total capex with growth capex (# of new subscribers added * Consumer Premises Equipment capex for these subscribers)
In this example, EBITDA has remained fairly constant, but Owner’s Earnings have decreased by c. 10% YoY mainly due to the increase in maintenance capex in 2015. This metric can therefore provide a better view of the business earnings rather than EBITDA as it gives the real dollar amount an owner can withdraw from the business without affecting operations.