About Me

My photo
An Investor and counsellor in Financial Market

Monday, April 30, 2018

Six precepts every investor should remember

To start, long-term investing. Here are a set of precepts every investor should remember.
  1. You can't start too early. Albert Einstein may not have said that compound interest is the eighth wonder of the world but it is a good motto to remember. Buttonwood started a pension plan for his daughters when they were three years old. Let us assume a return of 4% a year. That means a sum doubles in 18 years, quadruples in 36 and rises eightfold in 54. Looked at another way, say you have a set sum in mind for retirement. If you start saving at 20, you need to contribute only half as much money a month, as if you start at 30.
  2. Risk and reward are related, but don't think the latter is guaranteed. In financial theory, academics like Harry Markowitz and William Sharpe developed sophisticated explanations for the link between risk and return. This is where we get concepts such as the capital asset pricing model (CAPM) or beta, a security's riskiness relative to the market. But risk is measured in terms of short-term volatility. It is assumed, if you hold a risky asset long enough, you will eventually get rewarded. But this is not the case when you start from a high valuation—think of Japan in 1989 or the Nasdaq in 2000. Britain's FTSE 100 index is barely higher than it was at the end of 1999. A positive nominal return could have been earned from dividends but the real return this century from UK equities has been only 1.9%; real return from bonds 3.2%. Risk is not about volatility, it is about loss of capital. That is why investors should always have some money in cash or government bonds. 
  3. Long-term returns are likely to be lower from here. Even if equities do not perform as badly as in Japan since 1989, they are still likely to earn lower nominal returns from here. That is just maths. Short-term rates and long-term bond yields are low in both nominal and real terms. The return from equities is a "risk premium" on top of those rates. There is no plausible reason why the risk premium should be a lot higher today. The London Business School team of Dimson, Marsh and Staunton think it is currently 3.5%. Based on a return to mean valuations, GMO forecasts negative real returns for all equity markets bar the emerging ones (the same goes for bonds). US pension funds that think they are going to earn 7-8% are deluding themselves. 
  4. Charges are the financial equivalent of tapeworm. Say you invest $100,000 for 20 years and hope to earn 4% a year. There are two products available; one with an annual fee of 0.25%, and the other with a fee of 1%. How much more will the latter cost you? It is tempting to think the answer is small; it is only a difference of 0.75%. But the answer is $30,000 (see this SEC illustration). Of course, it is tempting to believe that the higher-charging product will deliver a higher return. But you don't know that; the one thing you know for certain are the charges. A recent FCA study showed that, net of fees, "more expensive funds have produced worse returns for the investor." Nor can you rely on funds that have done well in the past to do well in the future.
  5. Diversify globally. A lot of statistics about long-term performance are derived from America, which was the great economic success story of the 20th century. But this is an example of survivorship bias; back in 1900, people might have thought that Russia, or Argentina, would do as well or better. It is tempting for Americans to think that they don't need to invest abroad; most of the tech giants are based in the US. But the Japanese might have seen no need to invest outside their home market in the late 1980s, after its phenomenal post-war performance. The US market is more than half the MSCI World Index. It will not last. Diversifying protects the investor against currency risk and political mistakes. Economic power is shifting towards Asia (where it resided before 1500) and where more than half the global population lives.
  6. But don't specialise too much. The fashion today is to create thousands of different funds, covering ever smaller slices of the market. There has even been an ETF investing in ETF providers. Unless you are an investment professional who has researched the area extensively, you don't need this nonsense. Beware also of new investments that simply claim to be uncorrelated. That could just mean they don't rise in value when everything else does. The return from investing in equities is a share of profits; from bonds the risk-free rate plus credit risk. It is not at all clear what the return from investing in volatility should be (let alone cryptocurrencies). There may well be no expected return from them at all. So why buy them?

Friday, April 27, 2018

Economists still lack a proper understanding of business cycles

The second in our series on the shortcomings of the economics profession
THE aftermath of the 2007-08 financial crisis ought to have been a moment of triumph for economics. Lessons learned from the 1930s prevented the collapse of global finance and trade, and resulted in a downturn far shorter and less severe than the Depression. But even as the policy remedies were helpful, the crisis exposed the economic profession’s continued ignorance of the business cycle. That is bad news not just for the discipline, but for everyone.
The aim of those studying the macroeconomy has always been to understand the economy’s wobbles, and to work out when governments should intervene. That is not easy. Downturns come often enough to be a serious irritant, but not often enough to give economists sufficient data for rigorous statistical analysis. It is hard to distinguish between short-run swings and structural economic changes resulting from demography or technology. Most classical economists were sceptical of the idea that the macroeconomy needed much oversight at all.
By the early 20th century some thinkers were groping their way towards a better understanding of money in the economy, and how its mismanagement could cause problems. The Depression forced non-interventionists to concede ground. John Maynard Keynes blamed recessions on a shortfall of demand linked to changes in saving and investment behaviour. Governments used both monetary and fiscal policy with gusto in the years after the second world war to maintain full employment.
Yet the Keynesians’ heavy-handed approach never sat well with classically minded economists. In 1963 Milton Friedman and Anna Schwartz published their “Monetary History of the United States”, which resurrected the pre-Depression “monetarist” view that monetary stability can mend all macroeconomic ills. Other economists, including Edmund Phelps and Robert Lucas, recognised that people learn to anticipate policy changes and adjust their behaviour in response. They predicted that sustained stimulus would eventually cause inflation to accelerate and were vindicated by runaway price growth in the 1970s.
In the years that followed, Keynesians regrouped, borrowed ideas from their critics and built “New Keynesian” models (on which much modern forecasting is based). The synthesis of Keynesian and neoclassical ideas informed a new approach to managing the business cycle. The job was outsourced to central bankers, who promised to keep a lid on inflation. Adopted around the world, this approach seemed to work. Downturns became less frequent and less severe; inflation was low and stable; expansions became longer.
But all was not well. Many neoclassical economists rejected the “New Keynesian consensus” and worked along separate lines. Some followed their models back to the classical idea that fluctuations were natural and required no intervention. That occasionally led to absurd conclusions, for instance that falling inflation in the early 1980s had almost nothing to do with monetary policy. Although central banks largely ignored this work, its leading theorists retained influence within the profession—winning Nobel prizes, for example—and with conservative politicians.
The New Keynesians had their own troubles. To satisfy critics they built more mathematical models, which aimed to show how decisions by rational, forward-looking people could, in aggregate, cause downturns. The project was quixotic. People are often irrational. Their behaviour in groups is not as predicted by models that treat the economy as a mass of identical individuals. These models were complex enough to be fitted to almost any story. They could replicate features of the economy, but that did not amount to understanding why those features occurred.
The gap between many neoclassical economists and the New Keynesians running central banks remained unbridgeable. As Paul Romer has pointed out in some scathing recent papers, the rival camps were unable to settle their arguments by appealing to facts, or even to debate politely. You might suppose that the existence of wildly different business-cycle theories would make macroeconomists more humble, but no. Improbably, both groups argued that, in the words of Professor Lucas, the “central problem of depression-prevention has been solved”.
The return of depressing economics
Where consensus did prevail, it proved to be misguided. Economists of all ideological stripes cheered on the financial deregulation of the 1980s and 1990s. The work of thinkers like Hyman Minsky and Charles Kindleberger, whose writings on financial excess were rediscovered after the financial crisis, gathered dust. In a speech in 2005 to central bankers, Raghuram Rajan, an academic who later ran India’s central bank, warned of the risks building within the financial system. He got a chilly reception.
There has been progress since the crisis. New research questions the old orthodoxy on matters from the appropriate role of fiscal policy and the risks associated with large-scale financial flows to the relationship between unemployment and inflation. But the profession remains in a dangerous and unsustainable position. The macroeconomic approach favoured by economists within central banks, regulatory agencies and finance ministries has erred repeatedly in its prognostications over the past decade, predicting that labour markets would heal quickly, for example, while underestimating the risks of targeting a low rate of inflation. A compelling new paradigm seems a distant prospect. Nor is it clear economists are capable of sorting out their disagreements. Macroeconomics must get to grips with its epistemological woes if it hopes to maintain its influence and limit the damage done by the next crisis. Because economists have learned one thing: there is always another crisis.

Thursday, April 26, 2018

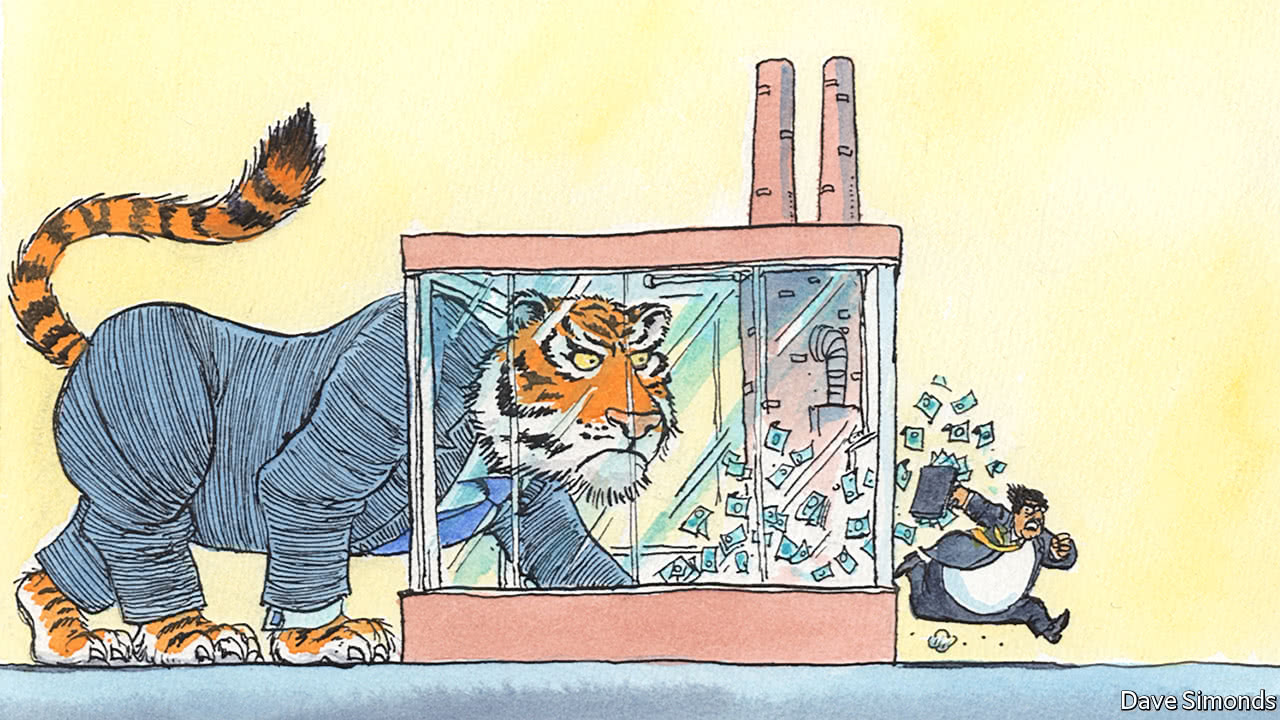
A new bankruptcy code is reshaping Indian business

Tycoons are under the cosh, and a dozen large firms have already in effect gone bust

ENRIQUE IGLESIAS, a Spanish pop singer, plays an unlikely part in the story of Indian capitalism. His presence at a party to mark Vijay Mallya’s 60th birthday, in December 2015, was, literally, a showstopper. A flamboyant booze heir, Mr Mallya was then best known for founding Kingfisher Airlines, which had earlier imploded because of its debts. Given that he had personally guaranteed some of these loans, the self-proclaimed “king of good times” was assumed to have been chastened. Upon hearing of Mr Iglesias’s performance, bankers—and politicians—started asking how Mr Mallya had continued to live so large. The party had lasted for three days.
Mr Mallya is hardly the only embattled Indian tycoon to have cocked a snook at his bankers. Some “promoters” of companies, as founding shareholders of Indian companies are known, have long made full use of a loophole of local corporate law that thwarted banks’ attempts to seize companies in default on their loans. A bunged-up court system made foreclosure all but impossible, so owners of even the sickliest of companies could spend lavishly without fear of repercussions.

The party is now over. Mr Mallya fled to London soon after the bash (Indian authorities are trying to extradite him on charges of fraud, which he denies). But the spotlight on him gave fresh impetus to discussions about finding ways to rein in failed promoters. A new bankruptcy code entered into force in May 2016, and after almost two years of preparation, governs the final rulings on its first big cases this month. Tycoons who had once fobbed off bankers are now getting turfed out of companies they had held onto for decades despite repeated defaults. As a result the outlines of a fresh era in Indian capitalism are taking shape.
The law is brutal for those who fall foul of their creditors. Promoters who have defaulted are explicitly banned from staying on as owners, following an amendment made to the code in November. If a firm is found to be insolvent by a specialised tribunal, the company’s board is in effect fired and an independent expert appointed to run the firm on behalf of its lenders. (In America, say, the owners of an insolvent firm usually continue to run it.) The new manager then prepares the company for fresh investors. If creditors cannot reach a deal in nine months, the business is liquidated and its assets sold for scrap—a bad outcome for all parties.
Before the code came in, promoters were able to stay on as managers in the stricken firms, which some unscrupulous moguls used as an opportunity to drain them of cash. Their position at the helm also gave them leverage in negotiations with bankers, who often had little choice but to agree to debt reduction.
The result of the new regime, says Rashesh Shah of Edelweiss, an investment bank, has been lively auctions for companies once thought to be impossible to liberate from their promoters’ grasp. A dozen large firms, that were in effect pushed into bankruptcy by the authorities last summer and given nine months to sort out the mess, have attracted winning bids from far and wide, including from the Tata Group and Vedanta, a mining giant. Deep pools of capital, such as Canadian pension funds, private-equity firms and the World Bank’s commercial arm, are among those looking to buy “distressed” assets.
Just this dozen big cases account for around 2.2trn rupees ($33.4bn) of bank debt. That is about a quarter of all the loans banks have already admitted are unlikely to be repaid. Nearly all of the problems lie with state-owned lenders, which have long made injudicious loans to large industrial projects, such as shipbuilding, steel or infrastructure, which have proven especially prone to default.
A further pipeline of 28 cases is due to be resolved by September, accounting for another 2trn rupees or so of bad loans. These include coal-fired power plants that are uneconomical to run, for which liquidation is a real possibility. All told, over 1,500 companies are said to have been deemed insolvent by the courts. The cases of several thousand more are pending.
The consequences are still being gauged. Lots of “zombie” companies which ambled on for years despite being unable to repay their debts may be acquired by healthier firms or closed down. Such consolidation will bring industry-wide benefits. And the share prices of firms owned by promoters with reputations for transparent corporate governance are already trading at a premium, says Sanjeev Prasad of Kotak, a bank.
But the disruption will have short-term economic costs. Many healthy firms deciding whether to build plants are waiting to see if they can buy distressed assets on the cheap instead, which prolongs a depression in the investment cycle. State-owned banks face hefty losses. Except for steel plants (which have returned to profit thanks to a resurgence in metals prices), investors sniffing out bargains are offering to buy bankrupt firms for less than half the face value of their outstanding loans, says Ashish Gupta of Credit Suisse, another bank. In one instance banks got just six cents on the dollar.
The bankers’ current pain will be the system’s future gain. The aim of the new law is as much to prevent future wrongdoing as to recover outstanding loans. Ashwini Mehra of Duff & Phelps, an advisory group, says promoters now approach banks well ahead of potential insolvency, in the hope of working something out before it is too late. That is an encouraging sign that the balance of power between debtors and creditors is shifting. “If you failed in business before, nobody thought there was a price to pay,” says Raamdeo Agrawal of Motilal Oswal, an asset manager. “Now, people aren’t so sure.”

Buy Dhfl @ 620

Target open

Stoploss 615

Wednesday, April 25, 2018

Planting the Seeds of the Next Crisis

en years ago, we experienced a financial crisis that almost collapsed the global economy. In 2007, as the stock market was at its peak and talking heads on TV were still arguing over a Goldilocks economy, Financial Sense's Chris Puplava warned to "Watch Out Below!" and "Proceed With Caution" because the "Worse Is Yet to Come."
This time on our podcast, Financial Sense Newshour discusses the threads of the last crisis and how surging debt levels combined with rising interest rates will create problems for the US and global economy once again.

Fed’s Herculean Efforts and Where We Stand Today

During the last financial crisis in 2008 and 2009, the Federal Reserve and other central banks implemented unprecedented tactics in an effort to pull the global economic system back from the precipice, and their efforts required trillions of dollars to hold the system together, reflate financial assets, and restart economies.
Today, that’s left markets near record price levels, and global economies are experiencing synchronized growth. Also, the US has embarked on a major fiscal stimulus program at this late stage in a business cycle. At the same time, the Federal Reserve has begun raising interest rates, leaving these two trends on a collision course.
fed funds risk neutral

If we examine the forces at play in the last crisis, many of the same issues at work back then are still present with us today. First, we see ample capital flows across borders. Second, we see record amounts of debt at the corporate, consumer, and government levels, and exploding debt-to-GDP ratios.
Third, we have ultra-low interest rates, which encourages risk-taking. Forth, we've seen the removal of safeguards from the financial system and lending. Fifth, we're seeing risk appetites increase across the globe as investors scramble for yield.
Sixth, emerging markets are heavily indebted in dollar-denominated loans, which presents a problem as rates rise and also if the dollar appreciates, leaving those loans more expensive. Lastly, we have the second-highest equity valuations in stock market history.
“Those are the known risks that we see today,” Financial Sense President Jim Puplava said. “But the real question is, there's the risk that no one is looking at.”

Deficits and Debt Will Add Up

Today, the major source of credit expansion has moved away from banks that could be overseen by regulators and the Fed, to the bond market serving as the major supplier of credit. This has enabled many governments and businesses to surpass their pre-crisis debt levels, Puplava noted, especially in emerging markets which have borrowed heavily in US dollars.
The US government could be on the way to trillion dollar deficits as soon as this year, and definitely by next year with US Debt now at 250 percent of GDP. Also, China has surpassed US debt levels in comparison to the size of their economy.
Low-interest rates are allowing governments, corporations, and consumers to roll over that debt at very low-interest rates, which is why we haven't seen a flare up in the form of a new crisis.
“The one saving grace is that we are at the lowest interest rates in human history,” Puplava said. “What that adds up to is, it's making servicing those debts much easier. … Overall interest expense on all the government's debt, private and public is only 2.34 percent. Now that figure is rising, it's up by almost 30 basis points from last year and will continue to rise.”

Risks Around the Corner

Global QE has kept a cap on rates, making the probability of a crisis at this point very low. This will change, however, as central banks led by the Fed change course for higher rates.
All the while, risk has not vanished from the financial system, as seen in bond and private credit markets, Puplava noted, which are highly correlated.
“We're seeing leveraged volatility in financial products as investors around the globe stretch for yield, meaning they're taking higher risk,” Puplava said. “At the same time, American consumer debt continues to surge everywhere.”
As the Fed raises interest rates, and the effects work their way through the financial system, because of the delayed market response, we could see one rate hike too many push the economy into a recession.
LIBOR rates, which are used to set interest rates on $200 trillion of dollar-based financial contracts globally, are on the rise, Puplava noted. As LIBOR rises, it will have far-ranging effects on markets around the world.
libor ois spread

“Here's the alarming fact,” Puplava said. “LIBOR has been rising for the last two and a half years, but, more importantly, it has started to accelerate. It's up by nearly 1 percent over the last six months, outpacing the Fed, and it will rise further as the Fed continues to raise rates.”
On top of this, we’re also seeing trillions of dollars being repatriated with the changes to the US tax code. Those trillions of dollars from overseas were being used as dollar funding loans, which kept LIBOR rates down. The largest source of demand for US dollars is coming from foreign banks, with a wide spread between US Treasury rates and foreign rates.
“There's no longer an advantage necessarily of going into US debt because of the wider interest rates,” Puplava said. “This is going to impact global capital flows into the United States. … The Fed has created a Frankenstein monster and now they're trying to kill it to extract themselves from the loose monetary policies they put in place to take us out of the last financial crisis. … They're more than likely going to take us into another crisis.”

Tuesday, April 24, 2018

Can the Netherlands Stay Ahead in Natural Gas Markets?

storm clouds

In 2016 the Dutch gas market achieved a major milestone when the TTF natural gas hub became the benchmark for European gas, taking the lead from the British NGC. The significance of this achievement has yet to be fully understood as major changes are happening domestically due to politically motivated output curbs and depletion of other major European fields. This article will look at the reasons behind the rise of TTF, its importance for European energy security and possible future developments.
On 29 May 1959 Dutch geologists made a discovery that would transform the Netherlands for the coming decades. The Groningen gas field is the 9th largest in the world with a volume of 2.100 km3 and the only European asset in the global top 20 list. This discovery enabled the Netherlands to become a major regional supplier of natural gas. Currently, 11.000 kilometersof gas infrastructure exists in the Netherlands and Northern Germany managed by state-owned Gasunie Transport Services (GTS), which primarily owes its extensive size to domestic gas recourses. The presence of sophisticated energy infrastructure is a significant contribution to the success of TTF.
The strategic location of the Netherlands and significant consumers adjacent to its borders has been a major boon. The potential of the Netherlands as an important gas hub was acknowledged in 2002 when TTF was formally set up and the ‘gas roundabout' strategy was developed by the Dutch government. Since then, several important interconnector pipelines have been created in all directions, LNG regasification facilities built, and stable political support has ensured the steady growth of liquidity on TTF.
In 2016, TTF transcended NGC, previously the leading gas hub in Europe, with a traded volume of 21.468 TWh or 2.198 bcm natural gas. To put that in perspective, the Netherlands produced approximately 80 bcm of gas in the same year. This enormous liquidity means that gas in the system is traded multiple times before being consumed and therefore positively contributing to the price levels.
Another reason for the TTF’s and the Netherland’s growth of importance as a major gas hub is the solid export capacity to neighbors like Germany and the UK. The construction of the interconnectors NEL in 2012 in Germany and BBL in 2004, has ensured import capacity from Russia and Norway and export to the UK. While BBL is an export pipeline from the Netherlands to the UK, technical changes to the system will ensure reverse flow capacity starting in the autumn of 2019 due to higher storage capacity in the Netherlands in the summer, and rising demand in Britain in the winter. Another development that will enhance TTF’s position versus NGC’s is Brexit, which analysts think will improve the former’s position as the leading gas hub in Europe.
Increased seismic activity allegedly due to natural gas extraction has dealt a blow to domestic production in the Netherlands. While 54 bcm was produced in 2016 from the enormous Groningen field, extraction has been capped at 21.6 bcm in 2017 with more reduction being planned. This has increased the need for imported gas from Russia and Norway. However, technical difficulties will have to be overcome as Dutch installations are meant to consume Groningen gas which is of low calorific value, while high calorific is the norm internationally.
Gasunie Transport Services (GTS) has also been looking far into the future where gas consumption could start to decline. GTS is fully owned by the Dutch state and billions have been invested in the pipelines. This investment could also be harnessed in the future. GTS has been investing millions in research and developments of techniques to store surplus energy during peak hours of renewable sources. This would extend the lifetime and use of the infrastructure.
Furthermore, GTS signed up to the North Sea Wind Power Hub on September 2017 together with other transmission system operators: Tennet Netherlands, Tennet Germany, and Energinet. The collaboration envisions cooperation on further research and on the possible creation of a massive wind park in the North Sea for the production of 180 GW of wind energy. The expertise and infrastructure under the management of GTS in the northwestern corner of Europe could be very valuable in order to distribute, for example, hydrogen that could be produced with wind energy from the enormous park.
The TTF gas hub has profited from the strategic location of the Netherlands, significant gas production in Groningen and high-tech infrastructure. Despite TTF being the benchmark for the longer-term contract in Europe, continued political support and technological developments are a necessity to retain its position for the future to come.

Monday, April 23, 2018

Indian states squabble over how to share out federal cash.

They are still measuring their size using census data from half a century ago.


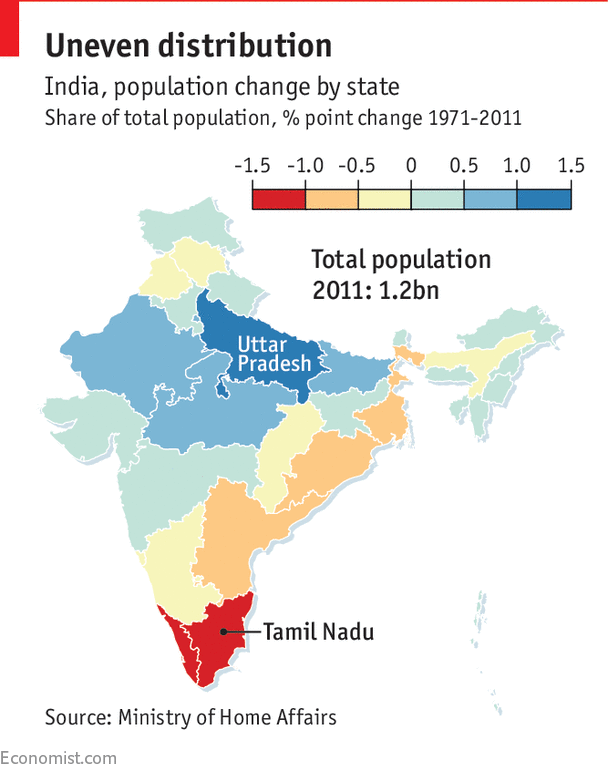
THE population of Uttar Pradesh is over 220m, enough to make the northern Indian state the world’s fifth-most populous country. But statistics still used by bureaucrats in New Delhi put it at less than 85m. Antiquated census data are used to split everything from federal funding to seats in the national parliament. A proposal to use up-to-date figures has created a political storm.

In the mid-1970s India’s southern states were doing better than northern ones at controlling population growth. That meant losing federal power and money, both doled out in proportion to population. The inelegant solution was to keep using census figures from 1971, an arrangement that became indefinite.
But buried in a recent government memo is a proposal to use figures from the most recent count, in 2011, for federal funding. Southern states are fuming. Their populations have risen since 1971, but nothing like as much as those of Uttar Pradesh and its neighbours (see map). They have also become much richer than northern states, not least because of lower fertility. That cuts their share of federal funding further.
The change would be a “punishment for states that had performed splendidly between 1971 and 2011 in stabilising their population,” thundered P. Chidambaram, a former finance minister (and southerner). The southern state of Tamil Nadu estimates that it could lose 800m rupees a year ($1.2bn), about as much as its policing budget.
The finance minister, Arun Jaitley, decried a “needless controversy”. But the row has a political dimension. India’s south is relatively less keen on the ruling Bharatiya Janata Party, which has its roots in the north. Regional parties, something of a thorn in the side of Narendra Modi, the prime minister, fear that a decision to stop using retro statistics to calculate federal funding would set a precedent for 2026, when the deal to allocate seats in the federal parliament using 1971 data is due to expire.

Friday, April 20, 2018

How developing countries weave social safety nets

More of the truly needy are being caught before they hit rock-bottom.


SOUP kitchens serve the needy for free; restaurants serve the hungry for money. In parts of South Asia, eateries near mosques sometimes fall into a third category. They feed the poor sitting patiently outside, whenever a pious or charitable passer-by pays them to do so. Alms-giving of this kind provides one traditional safety net for the destitute in developing countries. But it is, thankfully, not the only one.

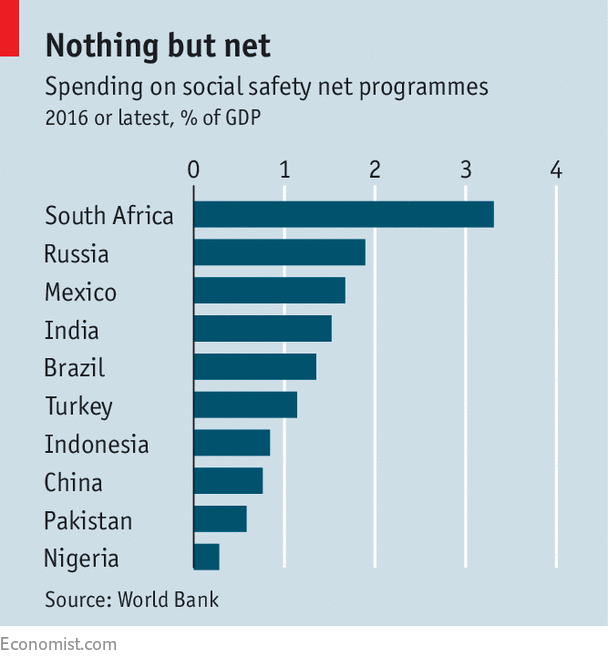
According to a new report by the World Bank, developing countries spend an average of 1.5% of GDP on social safety nets designed to stop people hitting rock-bottom. (The rich countries in the OECD spend on average 2.7%.) Among these are workfare schemes, pensions, free school meals and cash handouts, sometimes conditional on recipients sending their children to school, getting them vaccinated and the like. This spending has reduced the number of people living in extreme poverty (less than $1.90 a day) by 36% on average in the countries examined by the World Bank.
South Asia’s mosque-side restaurants will serve anyone willing to wait for a benefactor. Other schemes try harder to sift out undeserving cases. Public-works programmes, for example, provide money only to those willing to perform hard labour, like digging ditches or planting trees. In principle, these projects should attract only the most needy. In practice, they do not always work that way. Across the countries studied by the World Bank, public-works schemes do no better in screening out the better-off 40% of the population than other forms of safety net, such as conditional cash handouts.
Safety nets play a bigger role in some places than others (see chart). In South Sudan, two schemes financed by donors and run by the World Food Programme cost the equivalent of 10% of the new country’s measly GDP. East Timor’s pensions, paid to veterans of the resistance to Indonesian occupation, amount to 6.5% of GDP. Among the bigger emerging economies, Latin American countries are notably more generous than Asian ones. Mexico, for example, spends 1.7% of GDP on safety nets. The share in China, which is at a similar stage of development, is only half as large.
Regions also differ in their preferred style of safety net. Conditional cash transfers are popular in Latin America; public works in South Asia. East Asia tends to favour non-contributory pensions.
One reason for Asia’s relative stinginess may be a lingering belief that safety nets erode people’s work ethic and foster dependency. A former Singaporean official once talked disdainfully of a “crutch economy”, in which the rich were taxed heavily to support the poor. But even in Asia, safety nets are spreading. With the help of donors (including the World Bank), Indonesia expanded its “family hopes” cash-transfer scheme from 2% of the population in 2012 to 9% by 2016. The Philippines (also with outside help) expanded its scheme from 4% of the population in 2009 to 20% in 2015.
Will this new generosity create “crutch economies”? Quite the opposite. The World Bank cites a randomised trial of cash-transfer schemes in six countries, including Mexico, Indonesia and the Philippines, which found no evidence that beneficiaries worked less. Safety nets can also save households from desperate measures, such as selling assets at knockdown prices or taking children out of school so they can work. Such responses to immediate need can harm a household’s long-run prospects. The safety nets Asia is weaving might even spare some people from long, listless waits outside a mosque, hoping to be fed by the piety of strangers.

Thursday, April 19, 2018

Investors Are Getting Rich Off Venezuelan ‘Hunger Bonds’

Venezuela
With the American bond market being so languid, long-suffering investors have resigned themselves to sub-3 percent yields that the 10-year Treasuries are offering. But not everybody is ready to throw in the towel yet: Some investors have dug their heels in and are willing to purchase ultra-high risk bonds and hope for the best.
For the brave ones, the rewards can be huge.
At 13 percent interest, bonds sold by the state of Venezuela and its oil producer Petroleos de Venezuela (PDVSA) are the highest-yielding in the world, bar none. Venezuelan bond yields can sometimes reach gravity-defying heights:

There's a quid pro quo though: the Venezuelan government is dead-broke and the risk of not being paid is high. In fact, the yield curve by Venezuelan bonds is strongly inverted, implying that there's a very high chance you will not be paid a dime if you purchase short-term bonds such as 2-year and 4-year government notes.


Venezuelan bonds have been dubbed 'hunger bonds' due to the belief that proceeds from the bond sale only go to support President Nicolas Maduro's regime, while interest payments deprive the country of much-needed foreign exchange to import food for its hungry citizens.

But that hasn’t deterred Wall Street from trying to profit from the situation. Fidelity Investments, T. Rowe Price, BlackRock iShares, Goldman Sachs, Nomura Investments and Invesco Powershares are the top institutional holders of Venezuelan debt.
 And so far, it’s worked; at least for Goldman Sachs. The investment banker has reportedly received a $90 million interest payment for PDVSA 2022 VE112689168 bonds that the firm purchased last year.
Either Goldman is lucky or improving oil prices have finally pulled the government out of its deep hole. Last year, the Venezuelan government took the painful step of halting all foreign debt payments leading to the country defaulting on bonds worth $40 billion. Maduro has often been vilified for his willingness to sacrifice the welfare of his people in favor of maintaining the country's international standing.
Venezuela is the world's 11th largest oil producer, pumping out 2.3 million bbl/day. The Latin American country depends on the black commodity for 95 percent of its exports and 25 percent of GDP.


Stubbornly low oil prices over the past three years have wreaked havoc with the country's economy, leading to its present sorry state. Oil prices, though, have enjoyed a sustained recovery since mid-2017 and currently hover at 3-year highs.
WTI (Nymex) Price

Are Venezuelan Bonds Worth the Risk?
The Goldman Sachs interest payment gives bondholders whose payments have been in limbo a ray of hope. Fidelity, the biggest institutional holder of the bonds, is the top 401(k) provider in the U.S. with nearly 70 million customers. It therefore appears as if a lot of people have invested their retirement savings in Venezuelan debt. 
Some people might take the high road and object to supporting an autocratic government. If your only reason for feeling skittish about Venezuelan bonds is informed by morality issues, then take heart. The U.S. government has barred its citizens from buying newly issued Venezuelan bonds. The only way you can get them is by buying  from other traders on the secondary markets, meaning the funds will go to an investment bank on the other side of the transaction--and not Venezuela.
Still, the financial risk of these instruments is just too high. Bonds issued last year have lost nearly three-quarters of their value, and you risk having to sell yours at a loss, too, if the situation in Venezuela fails to improve.

Wednesday, April 18, 2018

Could Electric Vehicles Kill The Beverage Industry?

EV
As adoption of electric vehicles accelerates, there’s one potential industry that may lose big as road-trip lifestyles change and the indirect threat trickles down.
The industry is beverages, and the threat is not about electric vehicles themselves, but the gas stations that will go out of fashion as they make way for charging stations.
While it may seem like a benign threat, it’s anything but, say Morgan Stanley analysts, who note that the beverage sector will suffer from fewer stops to shop by drivers who will need less fuel.
Fuel accounts for only 40 percent of profit for gas stations, and most of the profit is made inside the store.
The claims were backed up by a recent survey conducted by the National Association of Convenience Stores that showed that nearly half of all convenience store customers mainly went into the store to buy a beverage.
While the Morgan Stanley’s note didn't touch on snack makers, they will likely be impacted by fewer fuel visits, too. Alcoholic drinks and tobacco products sold at convenience stores may not take the same hit.
“Despite lower exposure to gas stations, we see nonalcoholic ready to drink beverages (~11 percent) more at risk than beer (~33 percent) given impulse purchases and immediate consumption,” Morgan Stanley wrote.
Some would argue that this is a natural process, and a natural progression.
Similar fears were raised when people first started fueling up their own cars at the pumps and gas station jobs were threatened. In some countries in Eastern Europe and Asia, one can still fill up without getting out of the car. In North America and Western Europe, the gas station attendant is extinct.
But the world didn’t end, and everyone adapted. The beverage industry will too—both retailers and wholesalers—as long as they time their jump onto the EV train well.
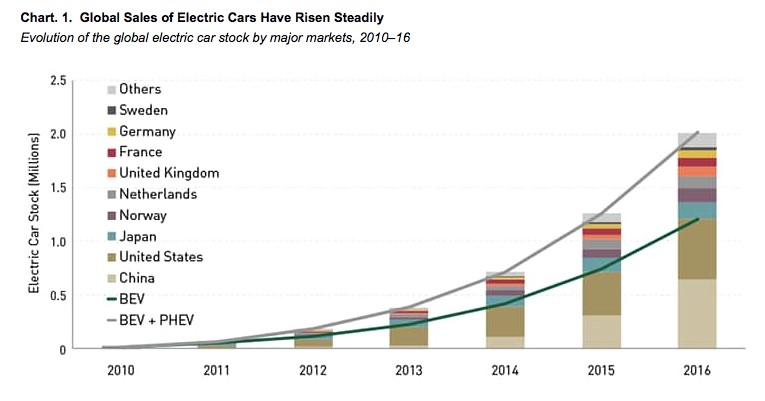
Estimates are that electric cars would take 35 percent of the global market by 2025 and 48 percent by 2030.

Even though electric vehicles still enjoy only a tiny market share, the auto industry is betting billions that they will soon be as cheap as conventional cars. However, there are still few things that have to line up in order to achieve that goal
First, the cost of building motors and components will have to continue to decrease. Experts agree that electric vehicles will go mainstream when the cost of the batteries is low enough to make it the same price to own a conventional car that runs on gasoline or diesel.

Merrill Lynch analysts expect electric vehicles in the United States will be cheaper than their traditional counterparts by 2024. Just a year ago, they estimated it would take until 2030. Battery prices, measured by the power they produce, have already fallen by more than half since 2011.
In order for electric cars to become commonplace, more charging stations will need to be built.
Considering the fact that the average range of an electric car is 180 miles, compared to 460 miles for a gasoline-powered car, the wide availability of charging stations is crucial. They’ll also need to able to charge faster.
There are already about 16,000 public charging stations in the United States, up from a few hundred in 2010. Still, that pales in comparison to the approximately 112,000 gas stations.
And then, there is a traditionalism, and fear of the unknown, which is likely to decrease with the change of generation as it always does. Most of the car buyers, Generation X and older Millennials, still find it hard to go electric. Speed, shifting gears and in some rare cases the smell and sound of petrol engine continues to hold some allure.
With all of this in mind, convenience store retailers have plenty of time to respond and make a strategy for moving forward with the future.
There is no doubt that the beverage industry will adapt to the trends, perhaps by installing charging stations, or making a fully-automated beverage and snack shop next to the EV charge-ups. Since EVs are the future, it’s not hard to see a marriage of something like Amazon GO’s checkout-less shops and charging stations.
On the flip side, if the beverage industry and convenience store segments are too slow off the starting blocks and fail to get in front of the future in time, fast food restaurants and coffee shops like Starbucks might be the immediate beneficiaries when it comes to beverages

Tuesday, April 17, 2018

Silver May Be Preparing For Its Strongest Bull Run In Years

Silver
Silver has been dead money over the past year or so, relentlessly grinding sideways to lower. That weak price action has naturally left this classic alternative investment deeply out of favor. Silver is extremely undervalued relative to gold, while speculators’ silver-futures positions are extraordinarily bearish. All this has created the perfect breeding ground to birth a major new silver bull market, which could erupt anytime.
Silver’s price behavior is unusual, making it a challenging investment psychologically. Most of the time silver is maddeningly boring, drifting listlessly for months or sometimes years on end. So the vast majority of investors abandon it and move on, which is exactly what’s happened since late 2016. There’s so little interest in silver these days that even traditional primary silver miners are actively diversifying into gold!
But just when silver is universally left for dead, one of its massive uplegs or bull markets suddenly ignites. Some catalyst, typically a major gold rally, convinces investors to return to silver. Their big capital inflows easily overwhelm the tiny global silver market, catapulting this metal sharply higher. Silver skyrockets to amazing wealth-multiplying gains, dwarfing nearly everything else. This reinvigorates silver’s cult-like following.
Silver’s dominant primary driver has long been gold, which controls all precious-metals sentiment. When gold isn’t doing anything exciting, silver languishes neglected. But once gold rallies high enough for long enough to convince investors a major upleg is underway, capital starts returning to silver. Thus silver is effectively a leveraged play on gold, amplifying its price action. Silver never soars unless gold is strong.
This psychological relationship is so ironclad it may as well be fundamental. The global silver and gold supply-and-demand profiles are technically independent, with little direct linkage physically. But when investment demand flares to drive gold higher, parallel silver investment demand soon materializes. So silver and gold often move in lockstep, especially when gold’s price action is interesting enough to catch attention.
All this makes the Silver/Gold Ratio the most-important fundamental measure for silver prices. The lower silver prices happen to be compared to prevailing gold ones, the greater the odds a major silver mean-reversion rally is imminent. And today silver is almost as low relative to gold as it’s ever been in the past century! This first chart looks at the SGR, or more precisely the inverted GSR, over the past 13 years or so.
The SGR calculation results in tiny hard-to-parse decimals, like this week’s 0.012x. So I prefer to use the gold/silver ratio instead, which yielded a cleaner 81.9x as of this Wednesday. Charting this GSR with its axis scaled upside down produces the same SGR line, but with far-more-brain-friendly numbers. This shows that silver is extremely undervalued relative to gold today, which is super-bullish for this neglected asset.
(Click to enlarge)
Again this week the SGR was running at just 81.9x, meaning it took almost 82 ounces of silver to equal the value of a single ounce of gold. So far in 2018, the SGR has averaged 79.6x. As you can see in this chart, that’s extremely low. There have only been two other times in modern history where silver looked worse relative to gold, late 2008’s first-in-a-century stock panic and early 2016’s secular-bear-market lows.
Because of silver’s tiny market size, it’s an incredibly-speculative asset. When investment capital flows really shift, silver can soar or plunge with shocking violence. Silver’s speculative nature makes it far more susceptible to general market psychology than gold. Silver acts like a small fishing boat battered around in the choppy waves of sentiment, while gold is more like a supertanker punching through them.
That 2008 stock panic was the first since 1907, one of the most-extreme fear events of our lifetimes. Technically a stock panic is a 20 percent+ plummet in the major stock-market indexes in less than two weeks. The flagship S&P 500 stock index indeed collapsed 25.9 percent in exactly two weeks in early October 2008, which terrified everyone. If felt like the world was ending, so investors and speculators sold everything to flee to cash.
Gold weathered that storm well, only sliding 3.3 percent in that wild stock-panic span. But the overpowering fear scared traders into hammering silver 23.7 percent lower. On exceptional stock-market down days, silver tends to split the difference between the S&P 500 and gold. We’ve seen that recently as well, during this new stock-market correction since early February. Silver is particularly sensitive to prevailing herd sentiment.
Between September and December 2008 straddling that stock panic, the SGR averaged just 75.8x. Silver was radically undervalued relative to gold, an anomalous state that has never been sustainable for long. The resulting mean reversion and overshoot higher was enormous, yielding stupendous gains for silver investors. Silver ultimately bottomed at $8.92 per ounce in late-November 2008, at a super-low 83.5x SGR.
Over the next 12.4 months silver rocketed 115.4 percent higher out of those extreme stock-panic lows, which restored the SGR to 63.2x. But that was still low. In the years leading into that stock panic, the SGR averaged 54.9x. For decades a mid-50s SGR has been normal, with silver generally oscillating around those levels compared to gold. Miners had long used 55x as a proxy for calculating silver-equivalent ounces.
Once silver falls to extreme lows relative to its primary driver gold, the inevitable resulting mean reversion rarely stops near the average. Instead it tends to overshoot proportionally to the upside, fueling massive gains. Silver started returning to favor in late 2010 and early 2011 as gold powered to major new highs. That ultimately climaxed with silver enjoying popular-mania-like popularity in late April 2011, at $48.43 per ounce.
That made for a total bull market out of those extreme stock-panic lows of 442.9 percent over 2.4 years! At its peak, the SGR had soared to 31.7x. Silver can’t sustain anomalously-high prices relative to gold either, so that bull soon rolled over as I warned the month before that peak. The key takeaway today is silver’s extreme stock-panic lows birthed a major new bull market. Silver can’t stay crazy-low relative to gold for long.
Unbelievably silver in 2018 is even more extremely undervalued than during those 4 months surrounding that stock panic! Again the SGR is averaging just 79.6x year-to-date. That’s considerably worse than during the stock panic which saw 75.8x over a similar time span. Such incredibly-low silver prices are no more sustainable now than they were then. That’s why a major new silver bull is likely coming very soon.
Interestingly the SGR popped right back up to its traditional mid-50s average after 2008’s stock panic as well. Between 2009 and 2012, the SGR averaged 56.9x. Those were the last quasi-normal years for the markets before the Fed’s unprecedented open-ended third quantitative-easing campaign started to wildly distort everything in 2013. Everything since then is literally a central-bank-conjured illusion that will shatter.
If silver merely mean reverts out of today’s worse-than-stock-panic extreme lows, regaining a 55x SGR would catapult it near $24.25 at this week’s $1333 gold levels. That’s almost 50 percent higher than today’s deep lows! From this week’s wild 81.9x SGR low, a proportional overshoot back up to a 28.1x SGR would blast silver back near $47.50. That’s 191 percent higher from here, nearly a triple, making for big gains.
All it will take to get silver mean reverting is a convincing gold upleg. Investors will return to silver once gold rallies high enough for long enough for them to believe its climb is sustainable. Then silver will take off and amplify gold’s gains. Gold powered 106.2 percent higher during that post-stock-panic silver bull where it soared 442.9 percent, making for 4.2x leverage. Gold also fueled silver’s last reversion rally out of extreme lows.
From 2013 to 2015, the stock markets surged relentlessly as the Fed’s vast QE money creation directly levitated them. Gold is an alternative investment thriving when stock markets weaken, so it was largely abandoned in those weird years. Gold ultimately slumped to a 6.1-year secular low in December 2015 leading into the Fed’s first rate hike of this cycle. That pummeled silver to its own parallel 6.4-year secular low.
In late 2015 silver felt a lot like it does today. No one wanted anything to do with it, everyone believed it was dead. Investors and speculators alike wouldn’t touch silver with a ten-foot pole near those lows, convinced it was doomed to spiral lower indefinitely. Yet out of that very despair a new silver bull was born. Over the next 7.6 months into August 2016, silver powered 50.2 percent higher on gold’s new 28.2 percent upleg.
Unfortunately that new mean-reversion silver bull ended prematurely as gold’s own young bull suffered a temporary truncation. The extreme stock-market rally erupting after Trump’s surprise election victory on euphoric hopes for big tax cuts soon sapped the wind from gold’s sails. So it dragged silver lower during much of the time since. But the new stock-market correction proves that stocks-strong-gold-weak trend is ending.
That’s super-bullish for silver, especially with it trading at stock-panic-like extreme lows compared to where gold is today. As these wildly-overvalued stock markets continue sliding lower on balance, gold will return to favor. The resulting capital inflows driving it higher will get investors and speculators alike interested in silver again. And just like after past extreme lows, their buying will catapult silver sharply higher.
Today’s extreme undervaluation in silver relative to gold is reason enough to expect a major new silver bull to ignite soon and start powering higher. But silver’s bullish outlook gets even better. The silver-futures situation today is nearly as extreme, with speculators making exceedingly-bearish bets on silver. These will have to be reversed as gold rallies, unleashing massive silver buying that will quickly drive it higher.
Short-term silver-price action is dominated by speculators’ silver-futures trading. The extreme leverage inherent in silver futures lets these guys punch way above their weight in terms of silver-price impact. Each silver-futures contract controls 5000 troy ounces of silver, worth $81,400 even at this week’s very-depressed prices. Yet the maintenance margin required to hold a contract was only $3,600 this week!
That means silver-futures speculators can run extreme leverage up to 22.6x, which is outrageous. Most investors run no leverage at all of course, and the legal limit in the stock markets has been pegged at 2x for decades now. Compared to an investor owning silver outright, each dollar silver-futures speculators are trading can have over 20x the price impact on silver! This gives futures traders wildly-outsized influence.
Every week their collective silver-futures positions are detailed in the CFTC’s famous Commitments of Traders reports. The recent reads are every bit as bullish for silver over the coming months as the SGR is over the coming years! All it will take to get silver surging higher again is for these universally-bearish traders to start buying again. And with the extreme leverage they run, the markets will force them to buy.
This chart shows speculators’ collective long and short positions in silver futures in green and red. They are now barely long silver while heavily short, making for exceedingly-bearish collective bets. Those will have to be unwound relatively rapidly once gold’s stock-market-selloff-fueled rally inevitably starts pulling silver higher again. This is the most-bullish silver-futures situation seen since just before silver’s last bull was born!
(Click to enlarge)
Let’s start on the short side, since that’s where speculators’ big silver-futures buying will begin. In the latest CoT week before this essay was published, current to Tuesday March 27th, speculators had total silver-futures shorts of 87.6k contracts. That’s truly extreme. Out of the 1004 CoT weeks since back in early 1999, that’s the 5th-highest spec shorting levels ever seen! Past extremes were never sustainable.
Note above that every single time the red spec-shorts line surged to highs, silver was bottoming ahead of a major rally ignited by short covering. That was true in late 2015 when silver’s latest bull was born, in mid-2017 during gold’s and silver’s summer-doldrums lows, and in late 2017 which saw extreme silver-futures short selling leading into another Fed rate hike. Silver rallied sharply after each shorting spike.
Silver-futures speculators are always wrong at extremes, because their very collective trading is what spawns those extremes in the first place. Once these guys have expended all their capital firepower to throw heavily short silver, there’s no one left to short sell it. Soon some get nervous and start to buy to cover their existing shorts. The only way to exit futures shorts is to buy offsetting long contracts to close positions.
And once short-covering buying starts on the periphery, the whole herd of speculators soon has to join in or risk truly-catastrophic losses. At today’s 22.6x max leverage available in silver futures, a mere 4.4 percent silver rally would wipe out 100 percent of the capital risked shorting it! So as soon as silver starts rallying when speculators are extremely short, they are forced to rush to buy to cover which catapults its price sharply higher.
No matter where the SGR happened to be, the 5th-highest spec shorts in silver-futures history would be wildly bullish for the near-term. But that’s not the whole silver-futures picture. It’s not just the speculators on the short side of the trade that are too bearish on silver, so are the long-side guys. In this latest CoT week, total spec silver-futures longs were only running 95.0k contracts. That’s just over a 26.2-month low!
Speculators’ collective bullish bets on silver via futures are slightly above their lowest levels since early 2016 when silver’s last bull market erupted! Unlike short-side traders who are legally obligated to buy to cover once silver starts rallying, new long-side buying is discretionary. But that very short covering drives silver higher fast enough to make the bearish long-side traders want to buy back in too, amplifying silver’s rally.
There’s nothing more bullish for silver over coming months than the rare combination of extremely-high shorts and very-low longs! This hasn’t been seen since late 2015 around silver’s 6.4-year secular low. Once silver started climbing on a parallel gold rally driven by short covering in its own futures, silver was off to the races on big futures buying. Speculators rushed to cover their excessive shorts and rebuild meager longs.
The resulting 30.0k contracts of silver-futures short-covering buying and another 55.6k of long buying catapulted silver 50.2 percent higher over the next 7.6 months. That adds up to 85.6k contracts of spec silver-futures buying. Today’s situation is even more bullish. If total spec shorts and longs return to their past year’s low and high, we’re looking at 54.5k contacts of short covering and another 59.5k of long buying!
That adds up to colossal silver-futures buying potential of 114.0k contracts over the next half-year or so. That’s the equivalent of a staggering 570m ounces of silver, or nearly 2/3rds of the latest read on annual world silver mine production! The potential silver upside that would be fueled by silver-futures buying of this magnitude is enormous. I suspect the resulting silver bull will dwarf the last +50.2 percent one in 2016’s first half.
Once silver starts rallying decisively on silver-futures buying, investors with their vastly-larger pools of capital will also start returning. Bullish analyses will explode, highlighting silver’s deep undervaluation relative to gold per the Silver/Gold Ratio. That will fuel bullish sentiment driving even more buying. Bull markets’ virtuous circle is buying begetting more buying. The more silver rallies, the more people want to buy it.
I’d be very bullish on silver with only a stock-panic-level SGR, only extreme spec silver-futures shorts, or only very-low spec silver-futures longs. But seeing all three at once, at a time when gold is rallying as the stock markets finally roll over out of their fake central-bank-spawned levitation, is truly extraordinary! This is literally the most-bullish setup for silver seen in years, so smart contrarian traders should be really long.
History proves that once silver starts moving, it will likely rally fast. As always, the biggest gains will be won by the fearless contrarians who bought in early before everyone else figures this out. Investors and speculators alike can play silver’s big coming upside in physical bullion itself, the leading SLV iShares Silver Trust silver ETF, and the silver miners’ stocks. But only the latter will greatly leverage silver’s gains.
Just last week I wrote a comprehensive essay exploring the recent Q4’17 results of the world’s major silver miners included in the leading SIL Global X Silver miners ETF. They are mining silver at average all-in sustaining costs of just $10.16 per ounce, far below even today’s low silver prices. So all of silver’s new-bull-market gains will be pure profit, leading to exploding earnings driving silver miners’ stocks far higher.
During 6.9 months roughly coinciding with early 2016’s silver bull, SIL rocketed 247.8 percent higher! That’s about 4.9x upside leverage to silver’s own gains. And given how absurdly low silver-stock prices are today, silver miners have similar-if-not-greater potential to amplify silver’s even-larger gains in its next bull. The elite major silver miners with superior fundamentals could be the best-performing stocks in all the markets.
The bottom line is a new silver bull is coming. Silver’s long and vexing sideways-to-lower grind has left it as undervalued relative to gold as during 2008’s stock panic. That anomaly was resolved by silver more than quintupling over the subsequent years in a mighty mean-reversion-overshoot bull. On top of that, silver-futures speculators’ short positions are at extreme highs while their opposing longs are at bull-birthing lows.
These wildly-bearish traders will be forced and motivated to aggressively buy silver futures once silver starts rallying decisively. That will be driven by gold strength like usual. Stock-market weakness ignites gold investment demand, driving both precious metals higher. Today’s silver setup is the most bullish in years. Everything is perfectly aligned for a massive new silver bull market to get underway any day now.