A favoured market ratio is not much use as a short-term indicator.
EVERY investor would like to find the perfect measurement tool to tell them when to get into, and out of, the stockmarket. The cyclically adjusted price-earnings ratio (CAPE), as calculated by Robert Shiller of Yale University, averages profits over ten years and is used by many as an important valuation indicator. Currently it shows that American shares have hitherto been more highly valued only in 1929 and the late 1990s, periods that were followed by big crashes.
That seems ominous. But as a paper by Dylan Grice and Gregor Obrecht of Calibrium, a Zurich-based private-investment office, makes clear, it is far from conclusive. The CAPE is not much use as a short-term indicator; it has been well above its long-term average for several years now, as it was in the late 1990s.
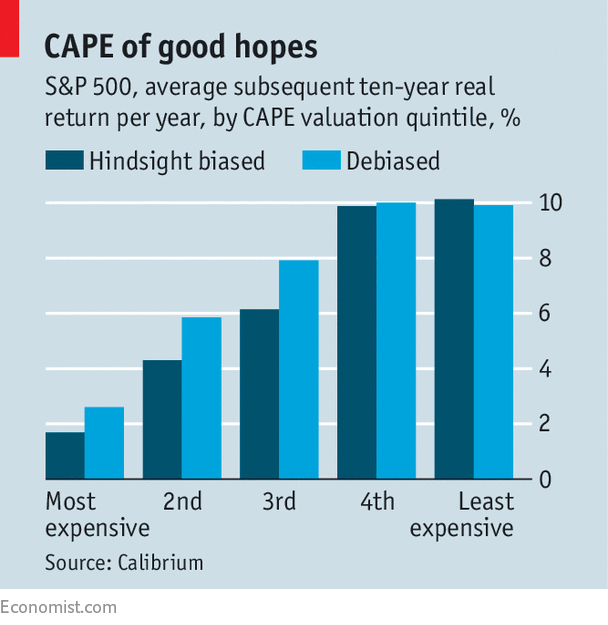
The main argument for the CAPE is a long-term one. If you divide all past CAPE values into quintiles, the annual returns earned over the subsequent decade by investing in equities when the CAPE was in its most-expensive quintile were more than eight percentage points below the returns earned when the CAPE was in its cheapest quintile (see chart).
However, the case is less cut-and-dried than those numbers seem. First, Messrs Grice and Obrecht point out that this approach is subject to hindsight bias. The long-term valuation range may be clear now; past investors did not know the range when they were actually buying shares. If the data are adjusted to reflect the historical data available to investors at the time, then the outperformance gap falls by more than a percentage point.
A more serious problem relates to the quantity of the data. Mr Shiller has 146 years of numbers for earnings; that breaks down into only 14 completely independent ten-year periods. It is pretty difficult to create a robust statistical case from such a paucity of numbers.
The authors calculate that, based on current valuations, the best forecast for ten-year real annual returns from American equities is 2.6%, well below the historical average. But the range of returns can only be estimated with reasonable confidence to be between -3.4% and +8.7%; something that is likely to seem too broad to be of much use to professional investors.
These criticisms are fair. So why, nevertheless, does it still seem likely that a high CAPE portends lower future returns? Future equity returns can come from only two sources—growth in profits, or the market’s placing a higher valuation on those profits. For example, a high CAPE might be justified when profits are unusually low, by the hope that earnings will recover.
However, profits are high, relative to GDP, at the moment. Perhaps this is the result of a shift in power in favour of capital, at the expense of labour; perhaps it is the result of the greater concentration of some industries, which has given certain businesses monopoly-like margins. It is possible that this shift is permanent, and that profits will not fall back as they have in previous cycles. But it seems the height of optimism to believe that profits will grow faster than GDP, ie, that the overall share of capital will rise even further.
GDP growth is itself largely driven either by an increasing number of workers or by a rise in their productivity. Since the size of the workforce is rising more slowly (and is set to fall in some countries), and recent productivity growth has been disappointing, it is hard to be more optimistic on this score. So rapid growth in either GDP or profits looks difficult to achieve.
Turning to valuation, some believe that the CAPE has trended higher in recent decades because of better accounting standards and corporate governance. Earning high returns in an era of sluggish profits growth would require valuations to rise even further, reaching dotcom-era levels. Even a partial reversion to the mean (the long-term CAPE average is 16.8 compared with about 30 today) would be very bad news. Here, too, there is a natural limit on returns.
However, the authors point out that investors are not looking at equities in isolation; they are choosing between asset classes including cash (yielding virtually nothing) and government bonds. Government-bond yields are very low in historical terms; in other words, valuations are very high. A comparison of the expected returns from equities and bonds shows equities should perform much better, even given the high level of the CAPE.
That insight chimes with the views of many fund managers. They are nervous about equity valuations but they find government bonds deeply unattractive. So they are stuck with the stockmarket as the “least dirty shirt” on offer.
No comments:
Post a Comment
Note: Only a member of this blog may post a comment.