At first blush, US stocks, gold and crude oil may seem like 3 very different markets:
- Equity prices essentially measure optimism related to human ingenuity (corporate profits) balanced with fears of equally human frailty (central bank management of long run inflation expectations).
- Gold, by virtue of its 5,000-year track record, prices the desire of market participants to hold physical assets that are no other participant’s financial liability.
- Crude oil prices reflect something akin to the global economy’s blood pressure reading. New technology has shifted this calculus over the last decade, but the world still uses 81 million barrels/day. Demand still matters to that market even if potential supply is higher than prior periods.
Against those differences these 3 assets share one common bond: they are priced in dollars. With rare exception you need greenbacks to buy all of them. On top of that, their units (S&P 500, troy ounce, 42 gallon barrel) do not change.
This combination of differences and commonalities makes a stock/gold/oil relative price analysis a useful exercise. We use World Bank data for each from 1970 – present (email us for the spreadsheet), which has longer run information than just WTI prices, for example. Here is what the latest data shows:
#1: The S&P 500 currently trades spot-on its long run average ratio to gold:
- The S&P 500 trades for 3119; gold is $1,471/oz. The ratio: 2.12.
- Over the last 30 years the average S&P/gold ratio has been 2.07.
- The chart below (1970 – present) shows how the S&P/gold ratio has done an excellent job of spotting when equity market optimism was either too high (1998/1999 at +4x) or too low (2008 – 2012, when the S&P 500 and an ounce of gold went for about the same amount).
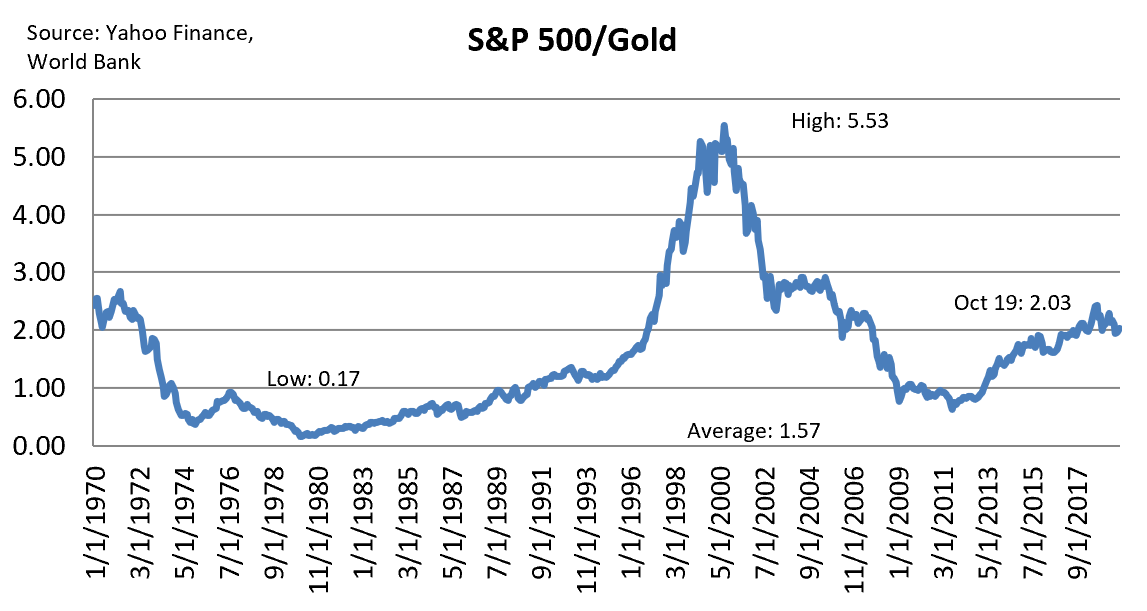
Upshot: by this measure the optimism imbedded in US equity prices is at equilibrium with the caution priced into gold markets.
#2: The S&P 500 does, however, trade rich to oil prices:
- The World Bank data uses a blend of WTI, Brent and Dubai prices. The average of those today is $59/barrel.
- That makes the S&P/oil price ratio 52.8.
- This is well above the 30-year average of 32.8, in fact fully one standard deviation (18.9) over the long-run mean.
- The chart below (1970-present) highlights that US stocks have been well above their long run average ratio to oil since 2015, when crude prices collapsed. They are not anywhere near the late 1990s (ratios +80x), however, which saw peak levels of equity market enthusiasm coupled with trough levels of global economic optimism due to the 1998 Asia Crisis.
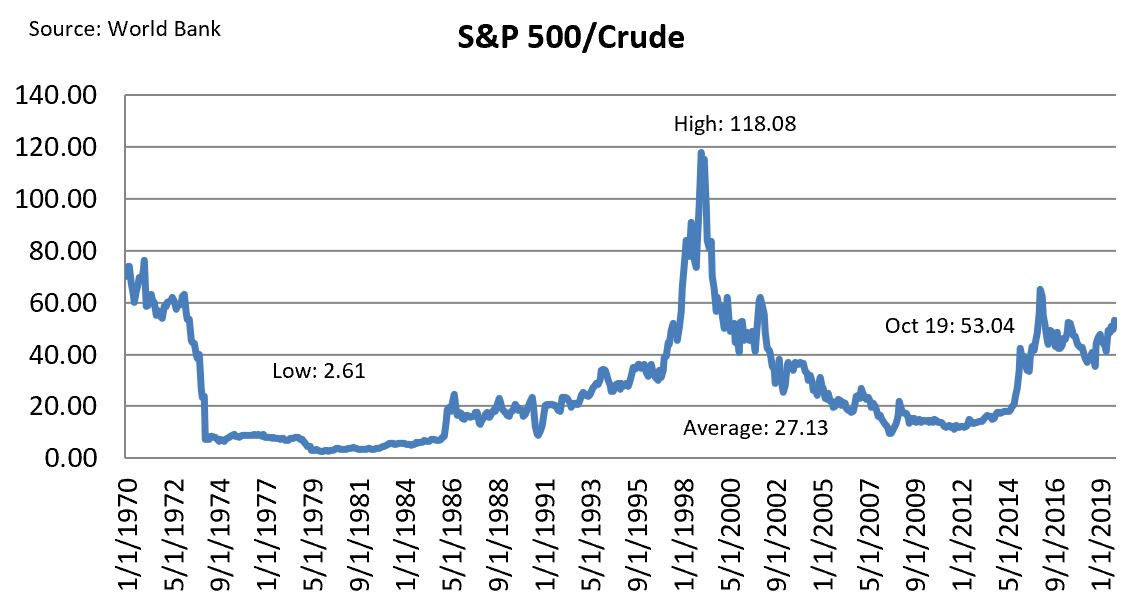
Upshot: that the S&P/crude ratio has run consistently at 40-60x since 2015 points to a systemic belief that equity valuations benefit from disruptive technology (Big Tech valuations/price gains) but oil prices suffer from the same phenomenon (American energy independence from new extraction methods).
#3: The gold/crude oil ratio is noisy through time, but at current levels the yellow metal looks expensive:
- The ratio here based on the prices noted above is 24.9x.
- The 30-year average is 16.8x, with a standard deviation of 5.8. That puts the current ratio almost 2 standard deviations away from the mean (28.4).
- The chart below (1970-present) shows you have to go back to the 1980s/1990s to find a period where the gold/crude ratio runs reliably above 20x. When it happens, however, it can be just as sticky as the 10-20x band we’ve seen more recently.

Upshot: oil comes up “cheapest” against both gold and stocks, but as with the prior point there’s good reason for that. In this case, no one has figured out how to frack gold deposits just yet.
* * *
Summing up: using these simple ratios we find that global capital markets are pretty well balanced between fear (gold prices) and greed (stock prices) but oil is clearly the odd man out. If your inner contrarian says that’s an opportunity, we would advise caution just now. Prior history says it can remain cheap relative to stocks and gold, even without the overhang of technological disruption.
No comments:
Post a Comment
Note: Only a member of this blog may post a comment.